Spirometry: Understanding the results
Rachel Booker
Rachel Booker
Master, OU, former clinical lead,
Education for Health
Freelance medical writer and editor
Former clinical lead for COPD and Spirometry at Education for Health
Co-author of: ‘Diagnostic Spirometry in Primary Care; proposed standards for general practice compliant with American Thoracic Society and European Respiratory Society’. 2009
In the previous article, we looked at how to perform spirometry correctly. In this, we explain the main measurements and what they mean, and provide the background to further study for those who wish to become involved in the interpretation of this important test
Spirometry, a basic test of lung function, is non-invasive and, when properly conducted and competently interpreted, is essential for the investigation of a wide variety of respiratory conditions. It is also extremely useful for excluding non-respiratory causes of cardiorespiratory symptoms.
Last month, our Essentials article described the basics of conducting spirometry and ensuring the technical acceptability, reproducibility and validity of the test results.1 The interpretation of results constitutes extended practice, for which you MUST be trained and assessed to ARTP (Association for Respiratory Technology and Physiology) standards by a recognised training body.2 (See resources section) This article aims to provide you with a background to the indices of lung function measured with a spirometer and what they mean. This knowledge can form the basis for further, assessed and accredited study.
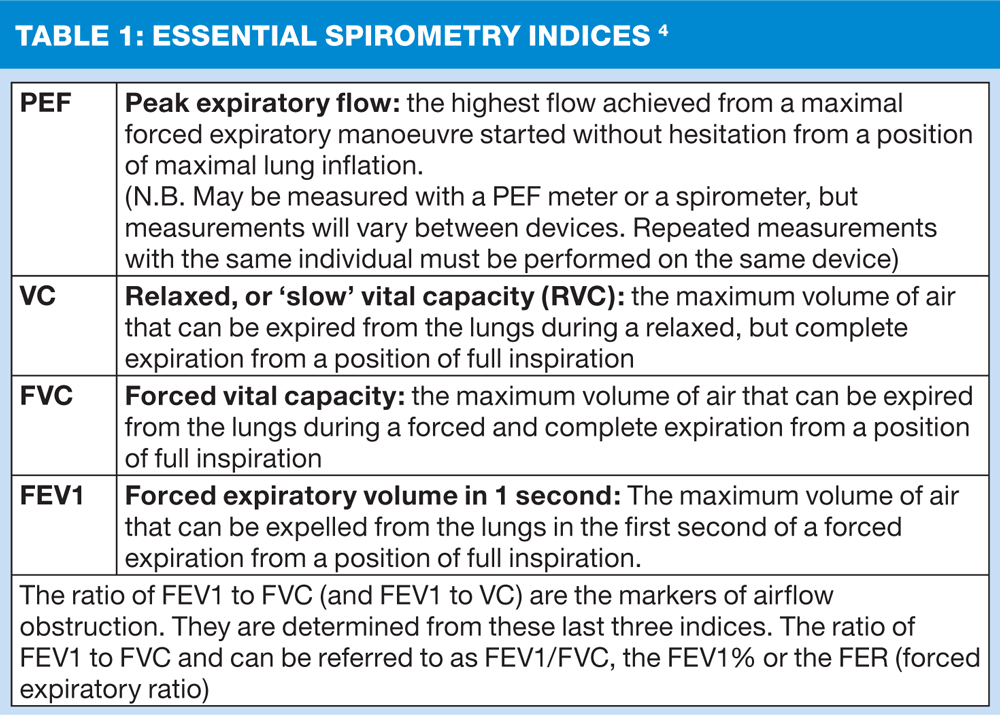
ESSENTIAL INDICES
Modern, electronic spirometers can sometimes offer a bewildering array of different spirometry indices, or measurements. In primary care settings a few, key measurements, detailed and defined in Table 1, are all that are necessary for basic interpretation.3,4
REFERENCE VALUES
In order to determine whether any individual’s spirometry is normal or not you will need to know what is ‘normal’ for a population of similar individuals. This is termed the reference or predicted value, determined from large, population surveys that have identified the mean (or average) lung volumes for individuals of each age, gender and height within that population. The 1993 European Community for Steel and Coal (ECSC) reference values3 are most commonly used in European populations and are programmed into the currently available, electronic spirometers.
In adults, lung volumes are dependent on gender, age, height and ethnicity and we live in a multi-ethnic society. The ECSC values can be adjusted, using ‘correction factors’. These allow you to multiply the ECSC lung function indices with derived indices for use in other ethnic groups. Other reference values are available for specific ethnic groups and the Global Lungs Initiative has recently developed new reference values.5 Whichever reference value you chose to use it is vital that it is applied consistently in subsequent tests on the same patient.
PREDICTED VALUES, LOWER LIMIT OF NORMAL AND THE Z-SCORE
A person’s recorded, best measurement of a lung volume is presented as a percentage of the reference value – the %predicted value. Lung volumes are expressed in both absolute terms (i.e. in litres) and as a percentage of the reference value. Volumes within 20% of the reference value (i.e. between 80% and 120% predicted) were generally considered to be within normal limits and many electronic spirometers still report results in this way.
Debate has, however, been raging about the use of %predicted to determine whether an individual has normal lung function. Population surveys to accurately determine the reference value for the young and the elderly are lacking. The use of %predicted values could therefore be misleading, particularly in these populations. Many experts now recommend the use of the more clinically significant lower limit of normal (LLN) values and the standardised residual (SR), or Z-score, to determine whether spirometry is normal or not, rather than a fixed 80-120% cut-off. The Primary Care Commissioning guide (2013) to performing spirometry recommends the use of Z-score.2
Healthy individuals of the same age, height, gender and ethnicity will have a range of shoe sizes and weight. They will also exhibit a range of lung volumes. The LLN, or ‘range’ of normal lung volume is calculated from the reference value and the residual standard deviation. The SR or Z-score is calculated from the mean predicted value and the residual standard deviation. The advantage of standard deviation is that it is independent of age, height and gender and has the same scale and value for all lung function parameters. The normal standard deviation, which will include 90% of a population, is 1.645. A Z-score below 1.64 carries a 95% chance of the value being outside the normal reference range and is therefore abnormal.2
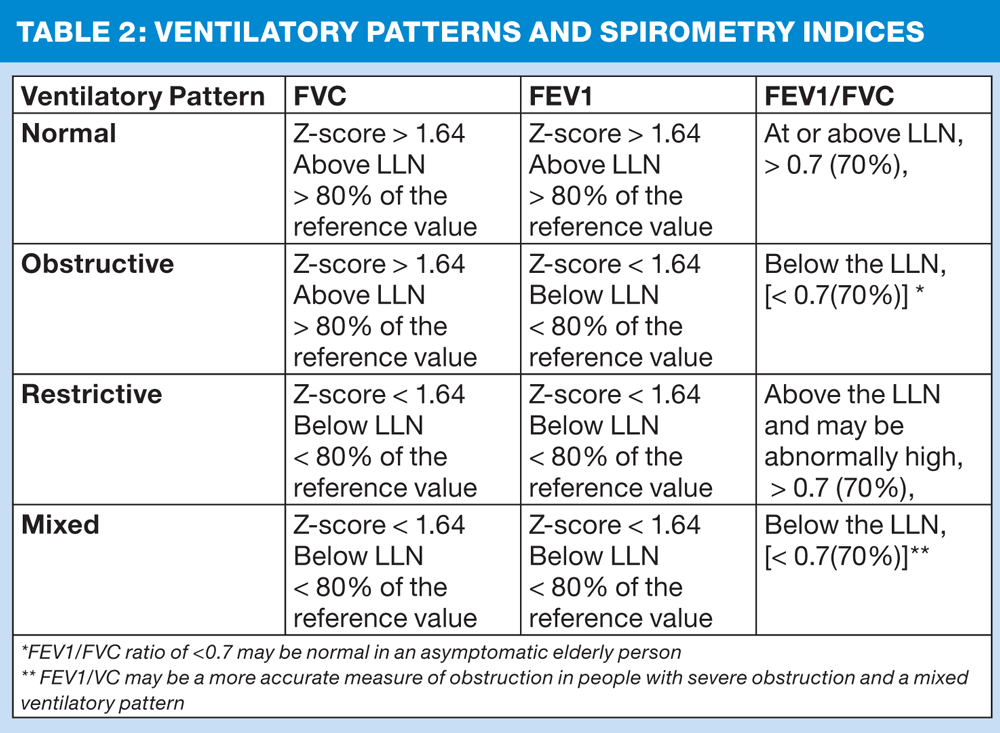
PATTERNS OF VENTILATORY FUNCTION
A spirometer, useful as it is, cannot tell you what is wrong with your patient. Spirometry can only identify patterns of ventilatory function, which together with a thorough clinical history, physical examination and appropriate further investigation, can point towards a diagnosis. The patterns of ventilatory function are:
- Normal
- Obstructive
- Restrictive
- Mixed
The effect of these different ventilatory patterns on the spirometry indices is summarised in Table 2.
Normal ventilatory function
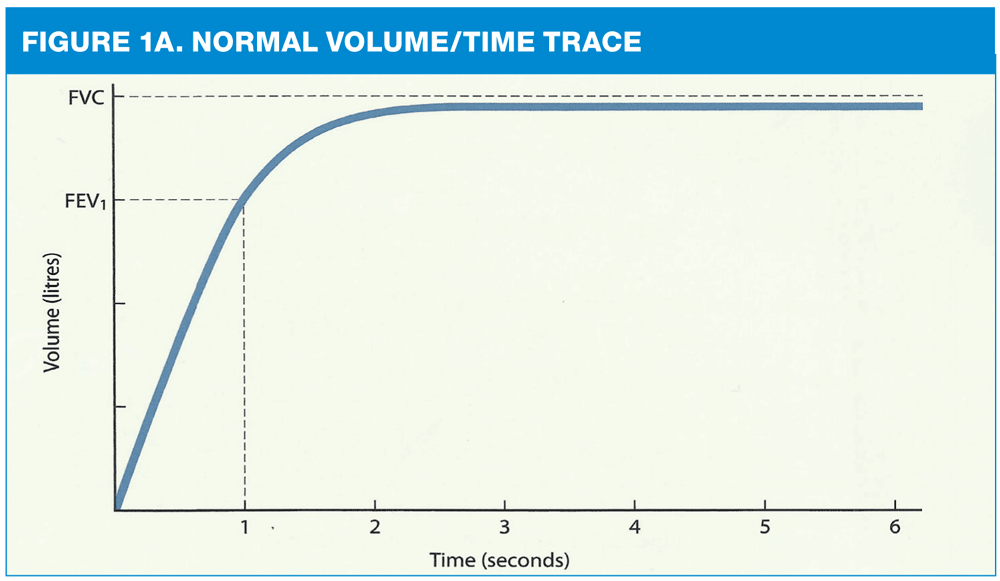
A healthy individual will have lung volumes, VC, FVC and FEV1, that fall within the normal range: i.e. they will have a Z-score of greater than 1.64, be above the LLN and be over 80% of the reference value. If the airways are normal the lungs can be emptied rapidly – usually within 4 to 6 seconds – and around 75% of the total amount of air will be expelled in the first second of a forced expiration. Thus, in a normal, healthy individual the ratio of FEV1 to FVC, or VC, will be around 0.75 or 75% and above 0.7 or 70%.
You may find the following analogy helpful. Picture the lungs as a balloon. The volume of air inside the fully inflated balloon is the FVC. If you let go of the neck of the balloon it will deflate rapidly and most of the air will come out in the first second. The volume escaping in the first second will be around 75% of the total; i.e. the FEV1 will be around 75% of the FVC – a ratio of 0.75. We will return to this analogy later.
The spirometry trace with volume on the vertical axis and time, in seconds, on the horizontal axis (the volume time trace) will show a typical shape. (Figure 1a) Since 75% of the volume of FVC is expelled in the first second the trace will rise rapidly and plateau between 4-6 seconds as the lungs are completely emptied.
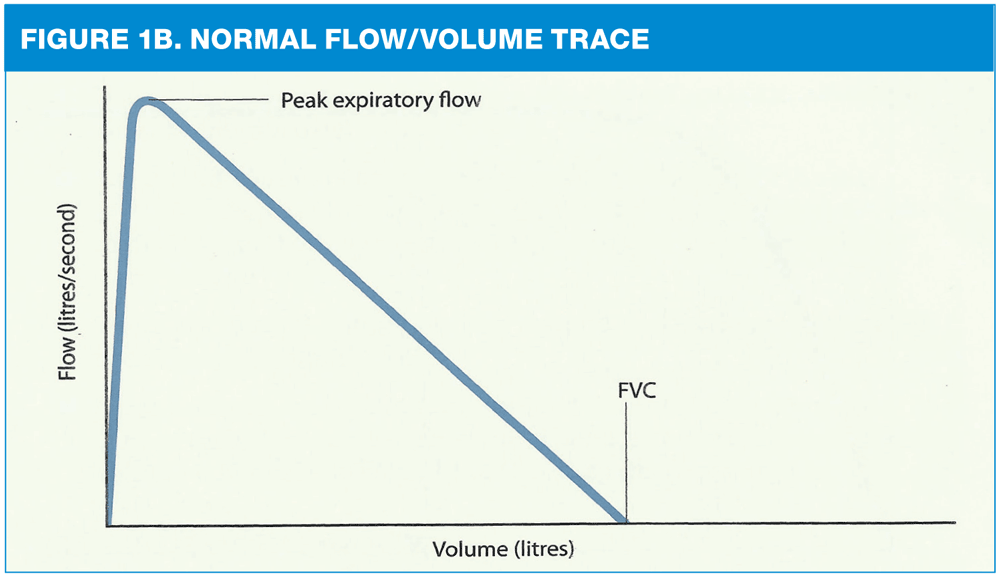
The spirometry trace with airflow rate on the vertical axis and volume on the horizontal axis (the flow volume trace) will also show a typical shape. (Figure 1b) Maximum flow in a forced expiration is reached almost immediately. The trace will rise almost vertically to a peak in the first 10 milliseconds – the peak expiratory flow rate. A trace that does not rise almost vertically signifies a problem with technique, usually a slow start or poor effort. In a healthy individual the flow rate will decrease steadily as air is cleared through the smaller generations of airways until the trace merges with the horizontal axis at FVC.
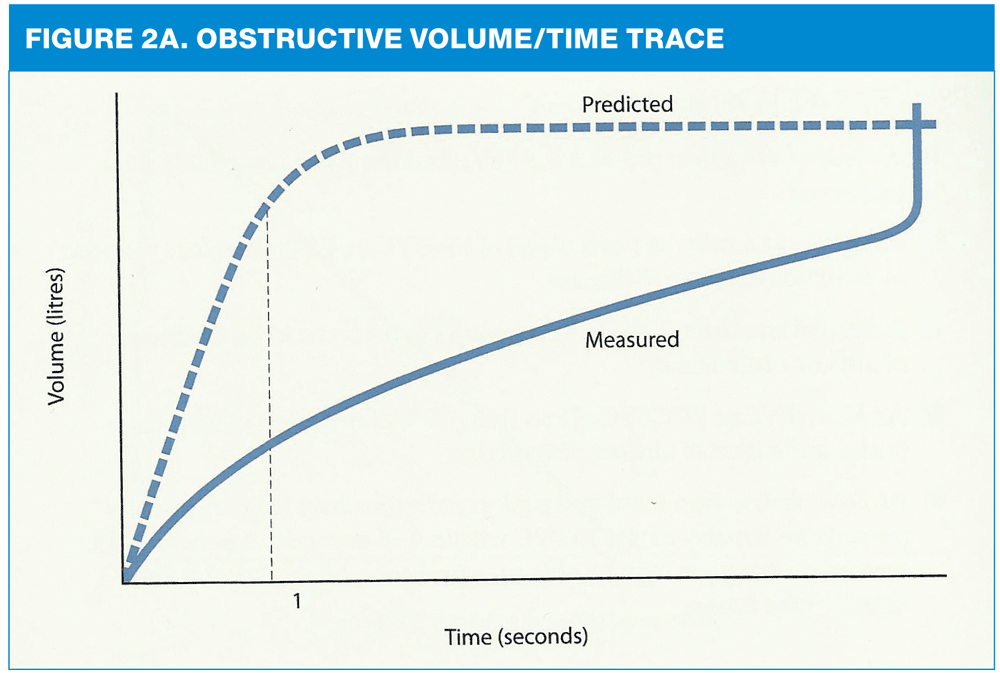
Obstructive pattern
The diseases that cause airway obstruction are few in number but common in primary care practice. They include asthma and chronic obstructive pulmonary disease (COPD). As their name suggests, they cause obstruction of the airways.
To return to the balloon analogy: picture the fully inflated balloon and think of the neck of the balloon as the airway. If you partially squeeze the neck of a balloon it will deflate more slowly. The total volume that comes out of the fully inflated balloon will be the same; i.e. the FVC and VC are unaffected and will remain above the LLN, have a Z-score greater than 1.64 and be above 80% of the reference value. The volume of air that can escape in the first second will, however, be reduced: the Z-score will be less than 1.64, the volume will be below the LLN and less than 80% of the reference value. Since the balloon/lungs deflate more slowly the FEV1 as a ratio or percentage of the FVC will be less than 0.70, or 70%.
The use of a 0.7 FEV1/FVC ratio as an indication of airflow obstruction has been hotly debated. The aging process affects the elasticity of the lungs and the lung volumes. Robust reference values for both ends of the age spectrum are lacking and the use of a fixed cut-off value of FEV1/FVC of 0.7 as diagnostic of obstructive airways disease can result in overdiagnosis in the elderly and underdiagnosis in the young. It is therefore recommended that the diagnosis of airflow obstruction be based on a FEV1/FVC and/or FEV1/VC below the LLN.2
The length of time it takes for the balloon to deflate completely will be longer; the forced expiratory time (FET), the time it takes to completely empty the lungs, will be prolonged.
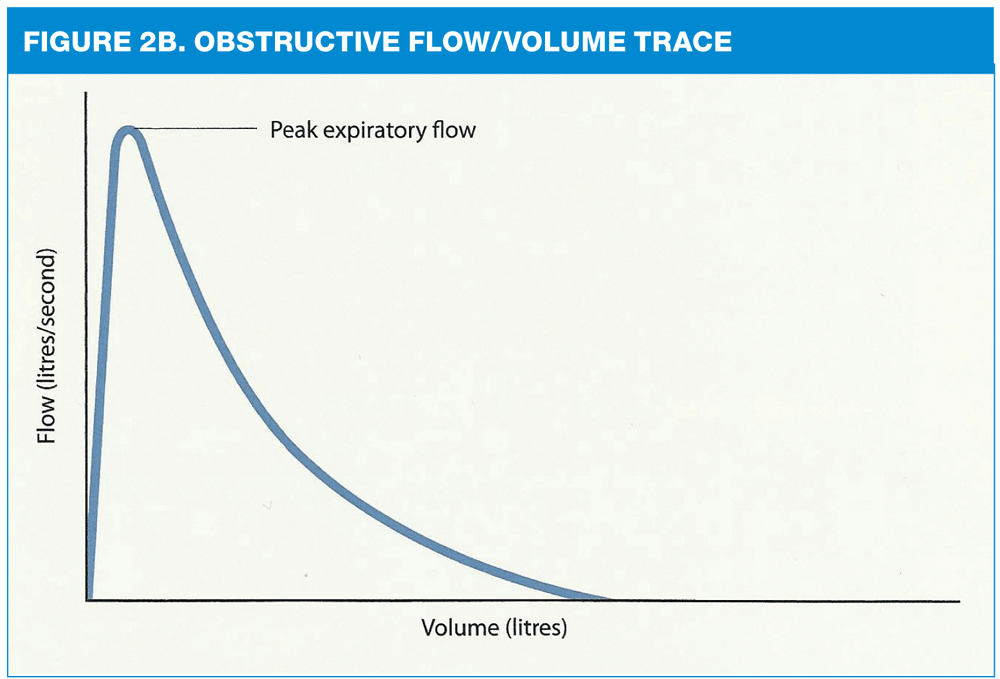
Since air can only be expelled from the lungs at a slower than normal rate the volume time trace will appear flattened and the time taken for it to plateau will be prolonged. (Figure 2a) The flow volume trace should still rise rapidly to a peak but air will be cleared more slowly through the obstructed, smaller generations of airways and the flow rate will fall more rapidly than normal, giving the trace a typical, ‘scooped out’, concave appearance. (Figure 2b)
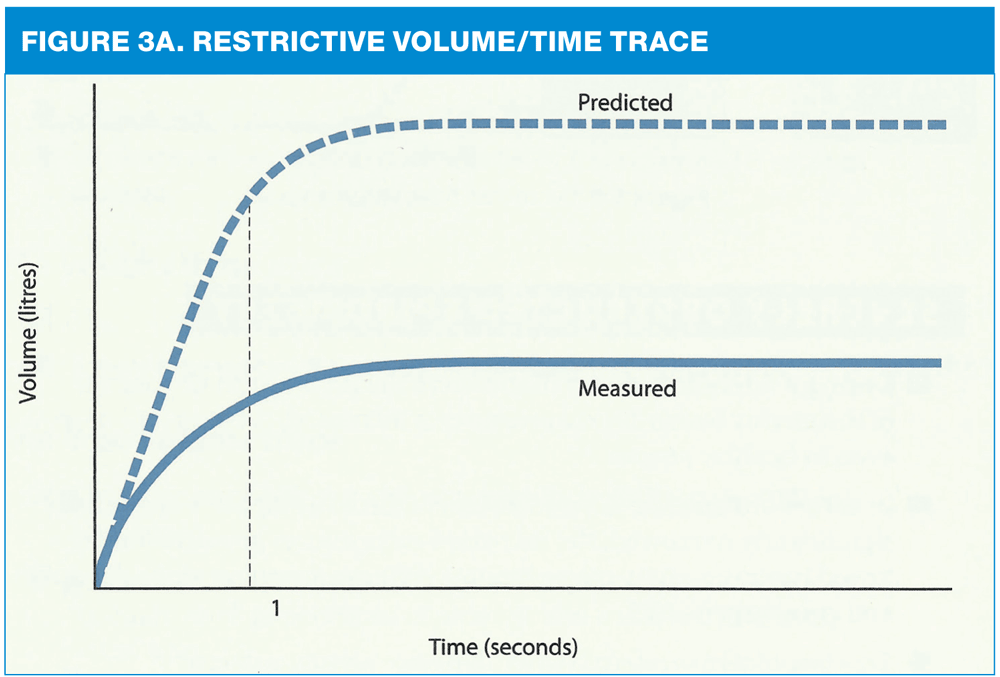
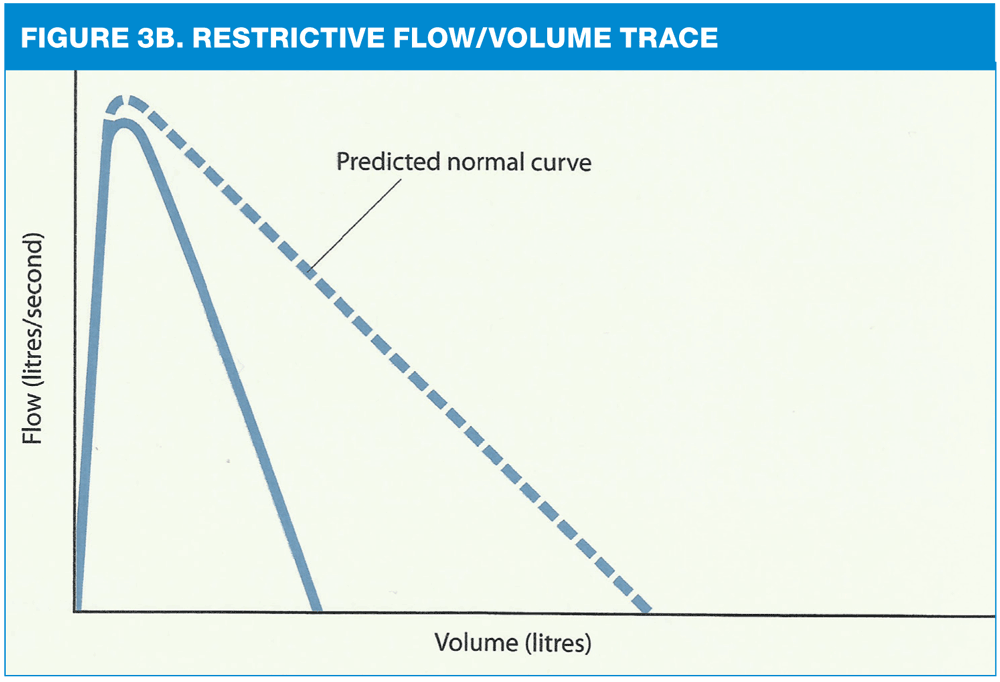
Restrictive pattern
Restrictive ventilatory patterns can be caused by diseases that cause fibrosis of lung tissue, (e.g. interstitial lung disease), surgery to remove a lung or lobe of a lung, and conditions that reduce the ability of the thorax to expand (e.g. kyphoscoliosis, obesity). What these diverse conditions have in common is that they reduce the ability of the lungs to fully expand, reducing lung volumes, but do not affect the patency of the airways.
To return to the balloon analogy: picture the balloon inflated inside a small cage or box. It will be unable to inflate fully; the FVC will be reduced. If you let go of the neck of the balloon it will deflate very rapidly because there is less air in it than normal and the neck of the balloon (the airway) is unobstructed. The volume of air that escapes from the balloon in the first second will be small because the total volume is small; the FEV1 Z-score will be low, the volume below the LLN and less than 80% of the reference value. The FEV1 will be reduced in proportion to the FVC. The FEV1/FVC ratio will be normal, or high.
The volume time trace will appear to be a normal shape, but will be small. (Figure 3a) The flow volume trace will appear rather ‘domed’ and narrow, or convex. (Figure 3b)
Unlike obstructive airways disease, the conditions that cause restrictive ventilatory patterns are many, but rare. The most common reason for such a pattern is a problem with the patient’s spirometry technique, with failure to exhale completely or to inhale fully! Should a true, restrictive defect be detected then referral for evaluation in secondary care is essential.2 Further pulmonary function tests, such as gas transfer and static lung volumes, will be necessary and the patient may require invasive procedures such as lung biopsy.
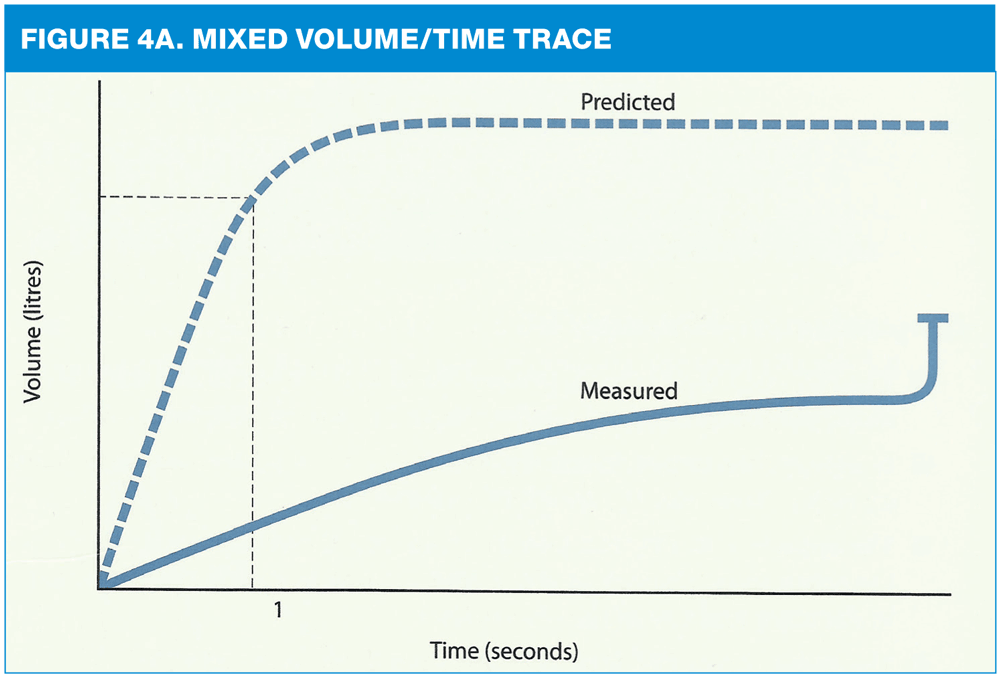
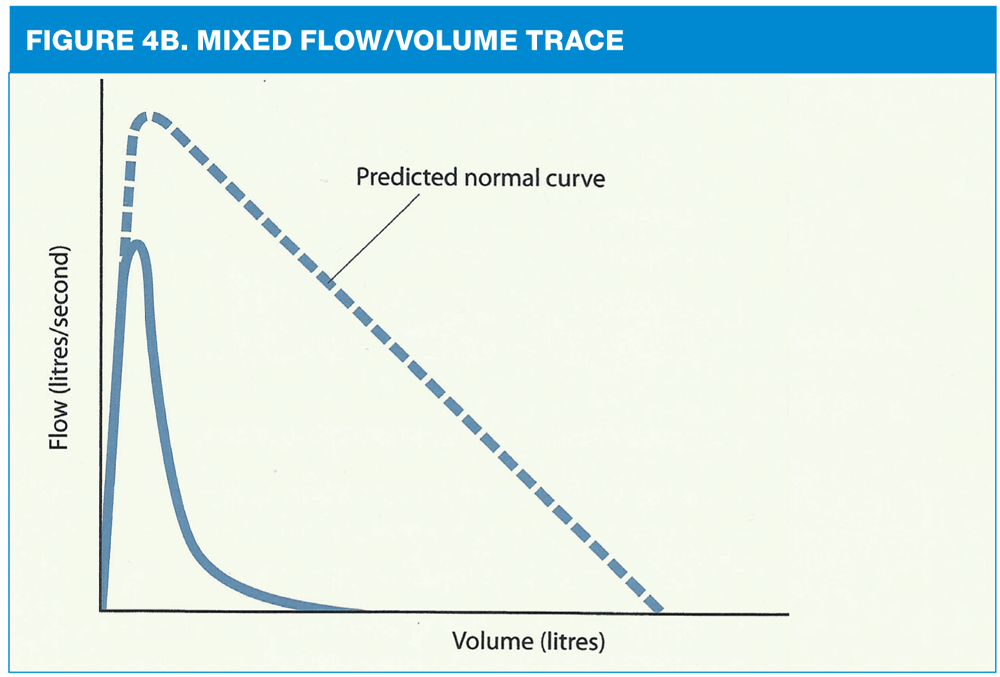
Mixed pattern
Severe airway obstruction can cause air to be trapped inside the lungs, preventing the lungs from expanding fully. The balloon is inflating inside the cage, or box, and the neck of the balloon is also being squeezed. This will result in a reduction in all the spirometry indices.
The volume time trace will be both flattened and small. (Figure 4a) The flow volume trace will be markedly concave and the trace will also fail to reach the predicted FVC on the horizontal axis. (Figure 4b)
A disease that causes a restrictive defect can, however, occur alongside one that causes obstruction, giving the mixed pattern described here. If there is any suspicion that this is the case the patient should be referred.2
CONCLUSION
Spirometry can provide extremely useful information, but is not diagnostic. The diagnostic ‘jigsaw’ begins with the clinical history and examination, providing a ‘pre-test’ probability of disease, and ends with the diagnostic tests (including spirometry) that prove or disprove the original hypothesis of what is wrong with the patient. Spirometry is but a piece of the jigsaw.
To be a useful piece of that jigsaw spirometry first needs to be properly conducted and then competently interpreted, in the light of the patient’s history and examination and alongside any other diagnostic tests that have been carried out. The performance and interpretation of this part of the diagnostic ‘jigsaw’ is now commonly carried out in primary care settings. This is to welcomed, but with some caveats. Spirometry is an effort dependent test that needs to be conducted by a trained and competent individual if it is to be valid. Interpretation of the results also needs a trained and competent person, able to determine what is normal and what is not. Accurate diagnosis needs someone with the skills to put all the diverse parts of the jigsaw together.
REFERENCES
1. Booker R. Spirometry: getting the test right. Practice Nurse. 18th October 2013; p12-17
2. Primary Care Commissioning. A guide to performing quality assured diagnostic spirometry. PCC. 2013 http://www.pcc-cic.org.uk/article/guide-quality-assured-diagnostic-spirometry
3. Quanjer PH, Tammeling GJ, Cotes JE et al. Lung volumes and forced ventilatory flows. Report Working Party Standardization of Lung Function Tests, European Community for Steel and Coal, Official Statement of the European Respiratory Society. European Respiratory Journal 1993; 16: 5-40
4. Levy ML, Quanjer PH, Booker R et al. Proposed standards for general practice compliant with American Thoracic Society and European Respiratory Society recommendations. Primary Care Respiratory Journal 2009; 18(3): 130-147 http://www.thepcrj.org/journ/vol18/18_3_130_147.pdf
5. Global Lung Function Initiative. 2012 http://www.lungfunction.org/component/content/article/86-about-gli/149-about-gli-home.html
Related articles
View all Articles