Understanding blood results: Urea and electrolytes
Margaret Perry
Margaret Perry
RGN BSc(Hons) MSC
Advanced Nurse Practitioner, Linkway Medical Practice, West Bromwich
In the second part of this series on blood chemistry, Margaret Perry explains the significance of 'U&Es' to make the task for practice nurses involved in assessing test results a little easier
Assessment of urea and electrolytes levels is a commonly requested blood test and may be used as a screening tool in patients who are unwell, or to detect abnormalities of blood chemistry and of renal function. In common with other blood tests there are several components that need to be assessed, and each has its own role to play in keeping the body functioning efficiently.
KIDNEY FUNCTION
In health the kidneys act as a filter, excreting waste products and fluids, and in so doing they keep the blood chemically clean by keeping the correct balance of electrolytes in the body. Waste products are formed from the breakdown of tissues and from food eaten in the daily diet. The kidneys can effectively maintain the electrolyte balance by excreting less if levels are low, or excreting more if levels are too high. If this process is impaired, waste products can build up in the bloodstream potentially causing toxicity and possibly damage. The kidneys are also responsible for the production of three important hormones, erythropoietin, renin and vitamin D. Erythropoietin stimulates the production of red blood cells, renin is involved in the control of blood pressure and vitamin D controls calcium uptake and helps make strong bones.1
MEASUREMENTS AND NORMAL VALUES
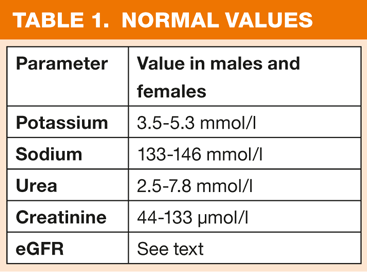
Reference ranges (Table 1) are devised following testing and application of the test to large numbers of individuals who have been selected and are thought to represent a 'normal' population. Once average values have been established a mathematical calculation is then applied to allow for what is perceived to be variation around the chosen value, and for natural variation around that value (plus or minus 2 standard deviations from the average). Reference ranges therefore represent the values found in 95% of individuals, which indicates that even in a 'normal' population, a test result will lie outside the reference range in 5% of cases (1 in 20).2
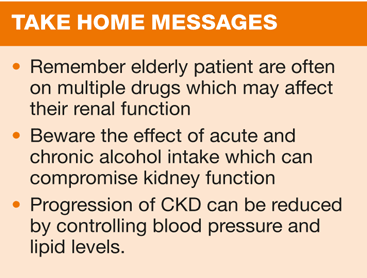
As with other laboratory tests there may be instances when results appear abnormal but they may be expected for that particular patient. For example, patients with heart failure and altered renal function frequently have altered creatinine and urea levels.3 This can be associated with their condition or may occur as a result of medication they may be taking. It is also important to consider that as well as these two issues, results can be also be affected by age and gender.
WHEN IS IT NEEDED?
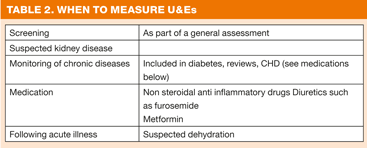
The test is requested for a number of reasons, and may form part of routine screening to assess kidney function or electrolyte balance.
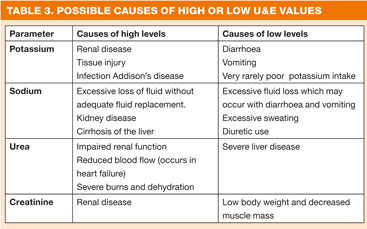
Table 2 shows reasons why the test may be undertaken, and some of the causes of high and low values are shown in Table 3.
POTASSIUM
Serum potassium is the major electrolyte within cells. The serum concentration is, however, so small that even minor alterations can have significant consequences.4 Hyperkalaemia is used to describe high levels whilst hypokalaemia relates to low levels. Potassium is obtained from the diet. Good sources include fruit and vegetables, nuts, milk, fish and shellfish and meats including beef, chicken and turkey.5 Once digested, potassium is excreted via the kidneys. However, there is no re-absorption of potassium from the kidneys, which means that if dietary intake is inadequate, potassium levels can fall rapidly.4 Low potassium levels have been linked to the development of cardiac arrhythmias, with one study suggesting this risk is increased among females, those with a past history of arrhythmias, hypertension and use of diuretics.6 Both high and low potassium levels can result in similar symptoms, either end of the spectrum resulting in symptoms such as weakness, fatigue, nausea and muscle cramps.7
SODIUM
Sodium is the major extracellular electrolyte and the sodium content in the blood is a result of a balance between dietary intake and renal excretion.4 Most of the sodium consumed in the daily diet comes from packaged, processed, store-bought, and restaurant foods.8 It is thought that only a relatively small amount derives from any salt added either during the cooking process or at the table. Many western diets contain a high salt content and this is of concern because diets high in sodium may partially or directly underlie or exacerbate a variety of chronic illnesses, including hypertension, stroke, kidney stones, osteoporosis, gastrointestinal tract cancers, asthma, exercise-induced asthma, and insomnia.9 However, in recommended quantities, salt has a vital role to play in maintaining health. As well as its role in maintaining fluid balance, nerve cells and muscle, sodium is needed for cells to function correctly. In nerve cells, sodium allows messages to be sent, and in muscle cells, it allows muscles to contract. Low sodium levels result in anorexia, nausea, lethargy and difficulty concentrating and, if severe, can cause seizures.10 Symptoms of hypernatremia (elevated serum sodium) tend to be nonspecific, with early symptoms of thirst, anorexia, nausea and vomiting, progressing to altered mental status, lethargy, twitching and tremor if left undetected or untreated.11
UREA
Urea is produced as a result of the breakdown of protein. When this process occurs, nitrogen in the form of ammonia is produced in the liver, which then combines with other chemicals to form urea, which the body deals with as waste. Urea is then released into the bloodstream where it is transported to the kidneys for filtering out of the blood so that it can be excreted via the urine. Healthy kidneys remove more than 90% of the urea the body produces, so blood levels can provide good information relating to how efficiently the kidneys are working.12 High urea levels (hyperuricaemia) can cause symptoms of fatigue, nausea, poor sleep patterns, and dry or itchy skin, whilst if a blood urea nitrogen test shows lower than normal levels, (hypouricaemia) it could indicate liver disease or damage, or malnutrition.13
CREATININE
Creatinine is a naturally occurring amino acid that is found in meat and fish, and also made by the human body in the liver, kidneys, and pancreas. It is then converted into creatinine phosphate which is stored in the muscles until it is needed to provide an energy source. Initially, raised creatinine levels may be asymptomatic, but as levels rise, symptoms of a low-grade fever, fatigue, lethargy, malaise, loss of appetite and changes in weight may also become apparent.14 Other symptoms include, breathing difficulties, headaches and mental confusion. However, high creatinine is not a good marker for early stage kidney disease, because it does not begin to rise until about 40 per cent of kidney function has already been lost.15
Creatinine levels are related to muscle mass and therefore low levels may be found in those with low muscle mass such as the elderly or those who are severely debilitated through illness. Low levels are not common and are not usually a cause for concern, but may occasionally be found in advanced liver disease.16
eGFR
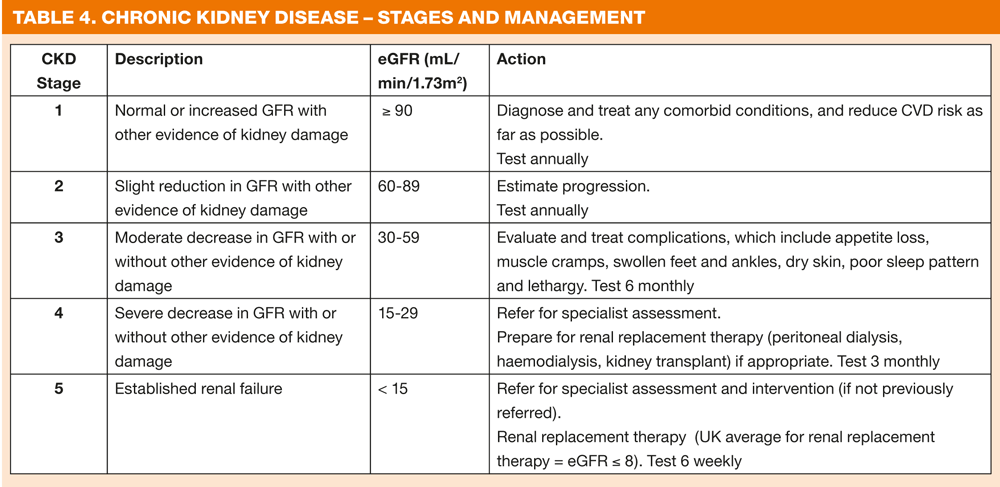
The estimated glomerular filtration rate (eGFR) is calculated (by the laboratory) from the serum creatinine level, taking into account the age, sex and race of the person. Glomerular filtration rate (GFR) provides an excellent measure of the filtering capacity of the kidneys, and therefore a low or decreasing GFR is a good index of chronic kidney disease. A decrease in GFR precedes kidney failure in all forms of progressive kidney disease.17 Total eGFR can therefore be used as an indicator of renal function. However, it is only an estimate and significant errors are possible in people at extremes of body type, for example malnourished patients.18 Ethnicity is also important when assessing results as the calculation used is not suitable for some particular groups. eGFR estimates should be increased by 20% in black patients.18 When eGFR is particularly low the patient may become lethargic, urine volume may be reduced and they may also develop symptoms of nausea and vomiting. Table 4 shows the stages of CKD in relation to eGFR values. Good practice indicates that identifying the presence and stage of CKD in an individual is not a substitute for accurate assessment of the cause of kidney disease, the extent of kidney damage and level of kidney function, management of complications of decreased kidney function or of comorbid conditions. Early recognition and treatment of risk factors for CKD including treatment of raised blood pressure, reduction of proteinuria, correction of anaemia and dyslipidaemia (to lower cardiovascular risk) may retard progression of CKD to end-stage renal disease, thus delaying the need for renal replacement therapy.19 Practice nurses play a vital role in hypertension and hyperlipidaemia management and are therefore already helping to slow progression in their patients with CKD.
PUTTING THE PICTURE TOGETHER
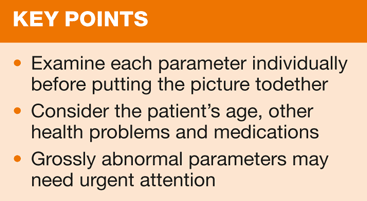
As with assessment of any blood results it is helpful to know why the test was requested: did the clinician suspect a problem, and if so what? When an abnormal results is received it is useful if there is an earlier result to compare the result with, which will give an indication of whether the problem is new, or if the abnormality has been detected previously, and if so has it deteriorated or improved. Once the abnormal result has been assessed, the GP will decide what further action is needed in the event of a grossly abnormal result, but practice nurses can play a vital role in the recognition of abnormal results, a task which will be made easier with increased knowledge and understanding. o
REFERENCES
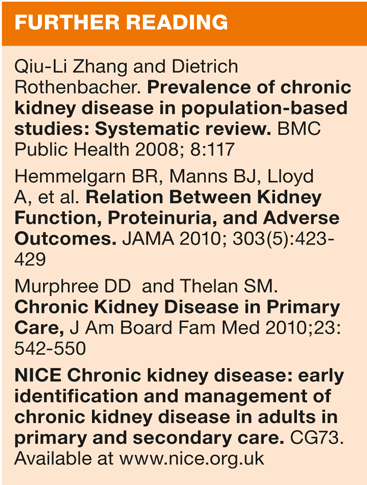
1. Kidney Health Australia. All about our kidneys. 2008 Available at: http://www.kidney.org.au/kidneydisease/howourkidneyswork/tabid/590/default
2. American Association for Clinical Chemistry. Reference Ranges & What They Mean: Lab Tests Online. 2011. Available at: http://www.labtestsonline.org.uk/understanding/features/ref-ranges
3. Klein L, Massie BM, Leimberger JD, et al. Admission or Changes in Renal Function During Hospitalization for Worsening Heart Failure Predict Post-discharge Survival. Circ Heart Fail 2008; 1(1):25-33.
4 Pagana KD and Pagana TJ Manual of Diagnostic and Laboratory Tests. 1998 Mosby, USA
5. NHS Choices. Vitamins and Minerals (2011). Available at http://www.nhs.uk/conditions/vitamins-minerals/Pages/Vitamins-minerals
6. Wahr JA, Parks R, Boisvert D., et al. Preoperative Serum Potassium Levels and Perioperative Outcomes in Cardiac Surgery Patients JAMA 1999; 281(23):2203-2210
7. Sheldon G. High Blood Pressure (Hypertension) 2011. Mayo Foundation for Medical Education and Research (MFMER). Available at: http://www.mayoclinic.com/health/blood-pressure/AN00352
8. Centers for Disease Control and Prevention. Sodium and Food Sources, 2010 Available at: http://www.cdc.gov/salt/food
9. Antonios TF, MacGregor GA. Salt-more adverse effects. Lancet 1996;348:250-1.
10. Craig S. Hyponatraemia in Emergency Medicine Medscape online Available at: http://emedicine.medscape.com/article/767624
11. Semenovskaya Z, Schraga ED Hypernatraemia in Emergency clinical Medicine: Clinical presentation. Medscape online (2009) Available at: http://emedicine.medscape.com/article/766683-clinical
12. American Association for Clinical Chemistry. Urea Test: Lab tests online. (2010). Available at: http://www.labtestsonline.org.uk/understanding/analytes/urea/tab/sample
13. Mayo Foundation for Medical Education and Research. Blood urea nitrogen test. (2010) Available at: http://www.mayoclinic.com/health/blood-urea-nitrogen/MY00373
14. Takon A.M Symptoms of high creatinine levels. (2011) Livestrong.com. Available at: http://www.livestrong.com/article/23480-symptoms-high-creatinine-levels/
15. Morgan S What causes high creatinine levels. (2011) Livestrong.com Available at: http://www.livestrong.com/article/124482-causes-high-creatinine-levels/
16. American Association for Clinical Chemistry. Creatine: Lab tests online. 2010 Available at: http://www.labtestsonline.org.uk/understanding/analytes/creatinine/tab/test
17. National Kidney Foundation Clinical Practice Guidelines for Chronic Kidney Disease: Evaluation, Classification, and Stratification : Part 5 Evaluation of laboratory measurements for clinical assessment of kidney disease. (2002) Available at: http://www.kidney.org/professionals/kdoqi/guidelines_ckd/p5_lab_g4.htm
18. The Renal Association. About e GFR The Renal Association. (2011) Available at: http://www.renal.org/whatwedo/InformationResources/CKDeGUIDE/AbouteGFR.asp
19. Eftimovska N, Stojceva-Taneva O, Polenakovic M. Slow progression of chronic kidney disease and what it is associated with. (2008) US National Library of Medicine, National Institutes of Health. Available at: http://www.ncbi.nlm.nih.gov/pubmed/18709007
Related articles
View all Articles
