Spirometry – moving forward towards early and accurate diagnosis
Chris Loveridge
Chris Loveridge
Respiratory Nurse RGN BSc (Hons)
Director, Inspirometry Training and Consultancy Limited
Practice Nurse 2023;53(5):11-16
A reluctance to jump through the hoops to obtain ARTP accreditation – and to pay the annual fee to stay on the register – means that many general practice nurses are being excluded from performing spirometry. But this does not have to be the case
Spirometry is recognised as an important part of the diagnostic process in respiratory disease.1 This became more apparent when the pandemic stopped all testing in the belief that spirometry was an aerosol generating procedure (AGP). The resulting waiting lists for diagnostic spirometry have led to an increase in delayed and missed diagnosis of many respiratory conditions.1
The cessation of services also raised the question – when restarting them was discussed – about the funding (commissioning) of spirometry services in general practice, with many practices coming to the realisation that they were not being funded via any contract. Annual spirometry is no longer a requirement of the Quality and Outcomes Framework (QOF) in the GP contract.2 Payment for 2023/24 is only made for objective testing in new diagnosis or when a patient is newly registered to the practice. Within this context, the diagnostic criteria are still set at FEV1/FVC ratio below 0.7 and this will be discussed later in the article when Lower Limit of Normal (LLN) is explored.
A recent report from Asthma + Lung UK1 suggests we should move towards diagnostic hubs and community diagnostic centres (CDC), but while some successful services exist, this model is not currently equitable due to lack of funding and insufficient trained staff to undertake spirometry.
The cause of much confusion in spirometry provision continues to be the need for Association for Respiratory Technology and Physiology (ARTP) accreditation which was advocated (but not mandated) in Improving the quality of diagnostic spirometry in adults: The National Register of certified professional and operators3 with the aim of standardising spirometry training and assessment.
Several versions of assessment (to obtain a place on the ARTP register) have been trialled in the intervening years with the overall outcome measured nationally by the number of names on the register. Sadly, the reality of what is happening in primary care is a reluctance to ‘jump through the assessment hoops’ currently in place, meaning many experienced health care professionals are not renewing places on the register, which, furthermore, now entails an annual fee. Many less experienced staff are reluctant to undertake an assessment that is seen to be arduous and not representative of primary care practice. In direct conflict with this, many commissioners are outlining service specifications stating that staff in diagnostic hubs (for example) must be ‘ARTP accredited’. This mismatch has resulted in some services unable to start as staff cannot be found to fulfil job specifications and deliver services.
Further changes in the register and training provision coincided with the pandemic, and the cessation of spirometry testing in primary care for two years undid many of the positive changes that had started to take place pre-pandemic and were replaced with confusion in primary care.
Rotherham Respiratory4 is a long-established training provider who proactively decided to create online spirometry training to help those who felt lacking in confidence but who were keen to restart spirometry when able to do so. The creation of an online spirometry update covered the new ARTP guidelines,5 and subjects such as LLN and Z scores. These were relatively new concepts to some, as was the change in reproducibility parameters from 100mls between blows to 150mls. The reproducibility of peak flows was also a new ARTP requirement.
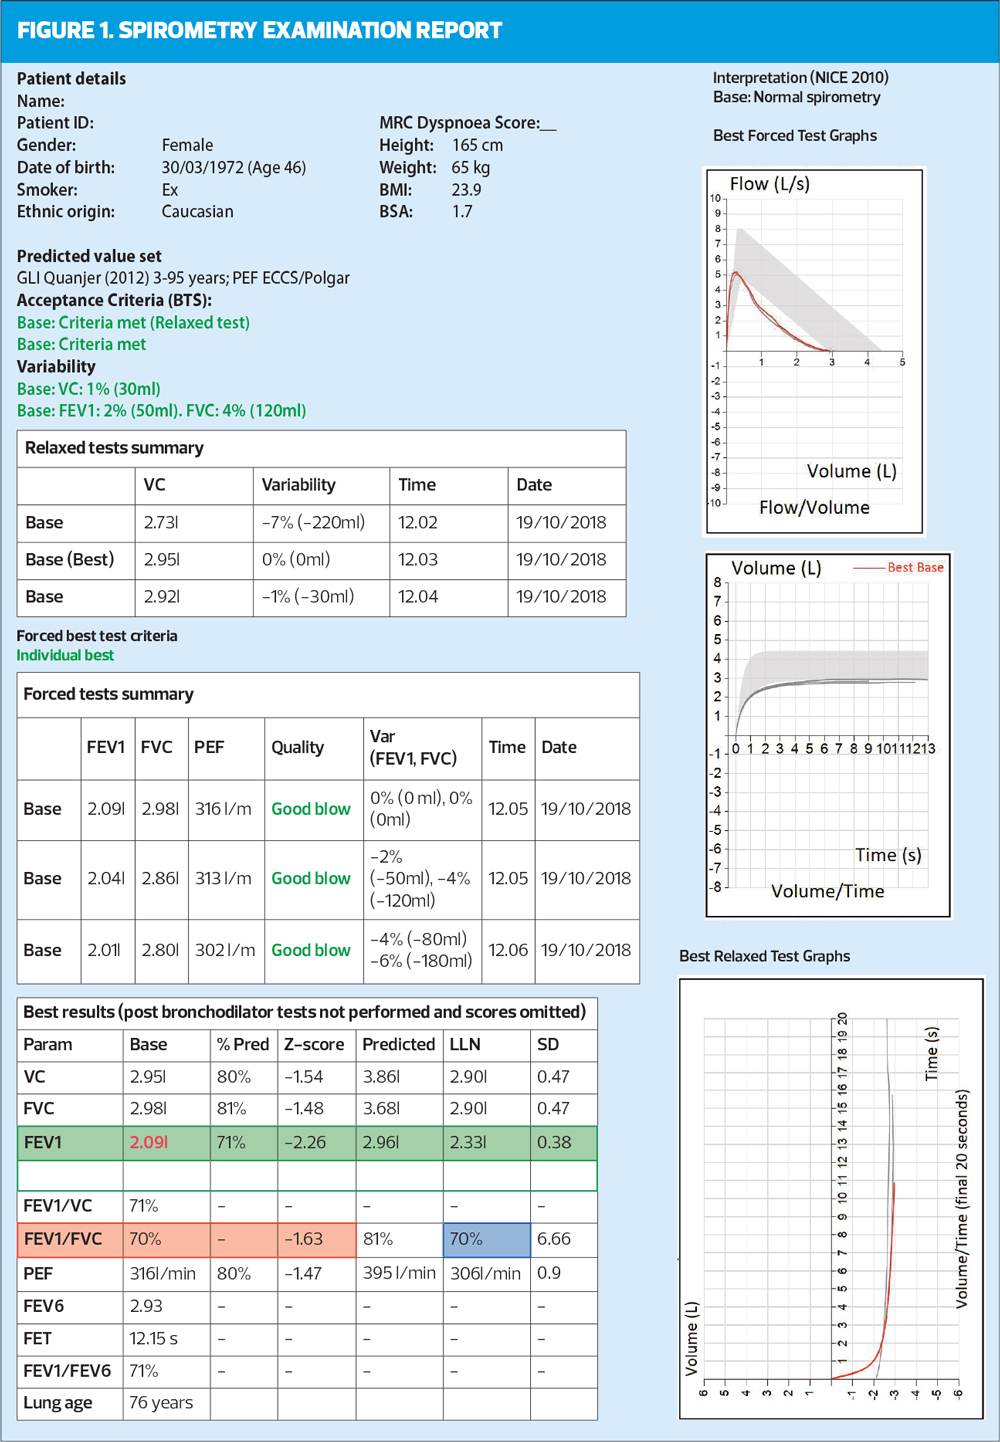
In the following case study, all these issues will be discussed to restore confidence and inspire those who still wish to continue with this important element of their role.All of Rotherham Respiratory spirometry courses follow The seven steps to standardised spirometry6 and this approach to the patient in Figure 1 will be used to demonstrate a systematic approach and highlight the key areas of change.
STEP 1. DEMOGRAPHICS
All patient details should be checked for accuracy and relate to the person on whom the test is undertaken.
In this example, we have a 46-year-old female who is an ex-smoker. She is Caucasian, 165cms tall and weighs 65kgs, with a normal BMI. The ‘new’ predicted values were used,7 and this should be considered if earlier values were used in previous tests. The importance of accurate height measurement should be stressed, as it is a key predicted value. With increased awareness of transgender people, we should also consider gender assigned at birth with time of transition and how they currently present. For example, a transgender woman who transitioned aged 30 years would need her gender assigned at birth (male) to be used for spirometry as the hormones given recently will not have impacted on lung development.
STEP 2. GRAPHS
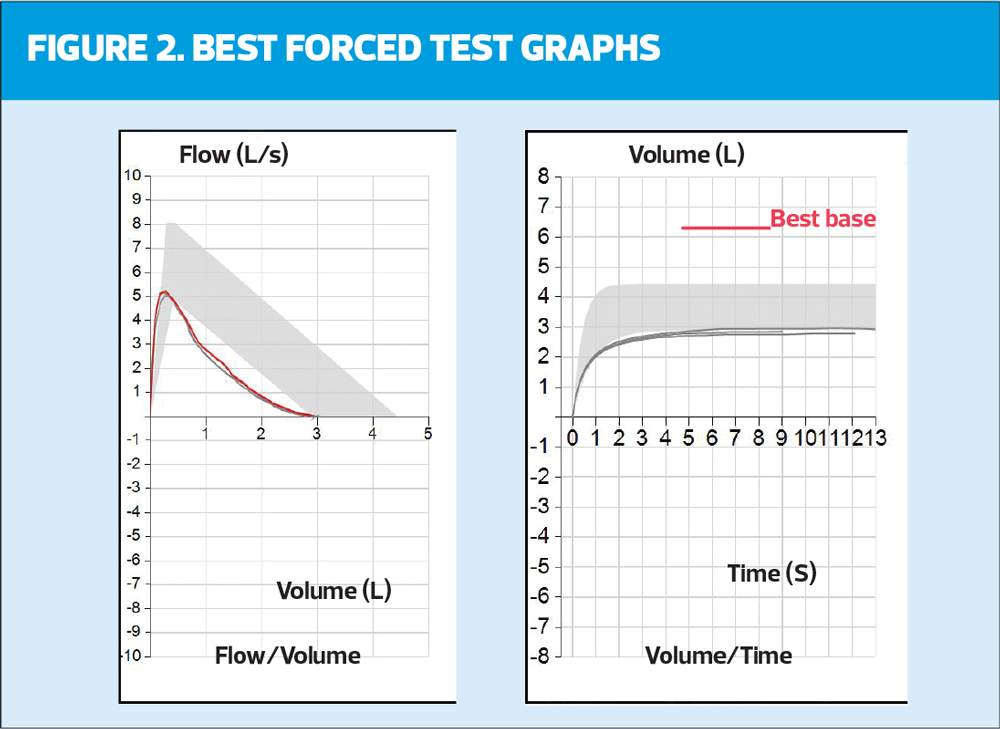
The minimum requirement to assess the technical acceptability of the blows are flow volume (FV) and volume time (VT) graphs, but they also give a wealth of other information. They are the first introduction to LLN, with the area seen on both graphs represented as the shaded grey area (Figure 1 and 2).
In the example in Figure 2, the blow on the left (FV) sits below the shaded grey area for the latter part of the blow but the peak expiratory flow (PEF) point falls within it. In the VT graph there is variability in the blows (they are all different lengths) and they all sit just below the LLN.
There should also be a check for errors. The FV should rise to a point (PEFR) and then fall with a smooth line (mirroring normality if normal) and then merge with the axis. Any sudden drop off or shortening of this blow will mean forced vital capacity (FVC) – the maximum amount of air that can be exhaled when blowing out as fast as possible – has not been reached, making the test invalid. This can also be checked on the VT graph where all blows should also be repeatable (sit on top of each other) and be similar lengths (time). In this example there are varying length/time of blows from 9-13 seconds. However, the minimum length of blow (6 seconds) has been reached. When this degree of variability in seen in the blows, the importance of reproducibility is increased in relation to the acceptability of this trace.
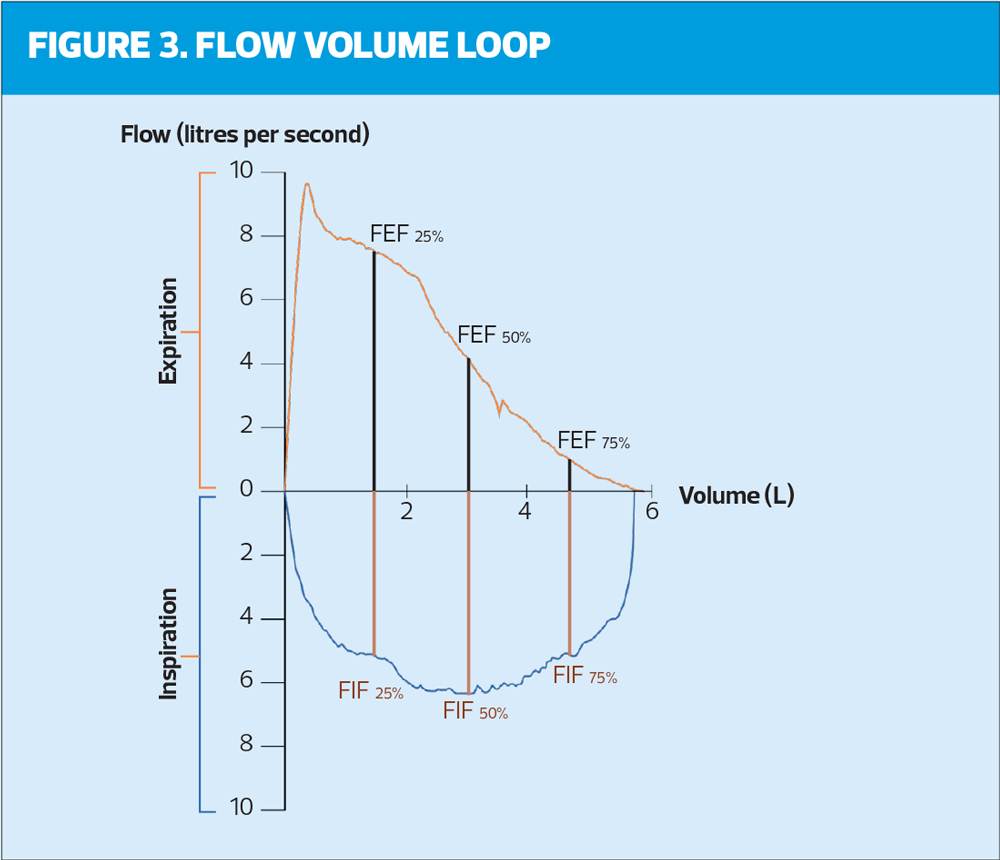
Recent ARTP assessment has seen the introduction of the Flow volume loop (Figure 3) where the inspiratory part of the blow has been shown. This is not undertaken in primary care and is not relevant in the type of spirometry undertaken by general practice nurses. Whilst the importance of the flow volume loop should not be discounted, it should sit within secondary care physiology laboratories when further investigation is necessary. The role of primary care is to ‘screen’ and diagnose the ‘straight forward’ cases knowing that onward referral to experts when results do not match the presentation and history is an option.
STEP 3. NUMBER AND QUALITY
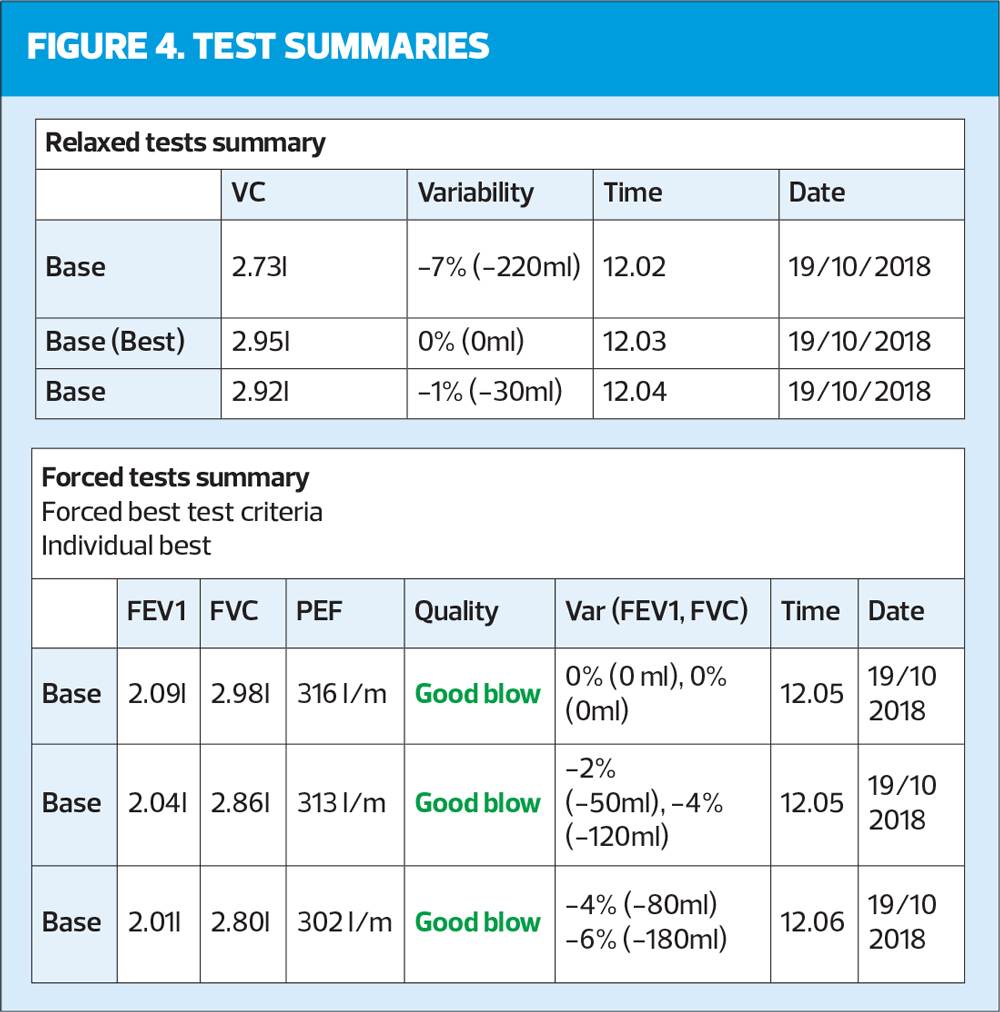
This step of the systematic review is checking the correct number of blows have been undertaken. There needs to be a minimum of three relaxed blows (VC, SVC, EVC) and a minimum of three forced blows (which include FEV1). There can be a maximum of eight forced blows in any one session, but it should be remembered that a tired patient will not be able to blow consistently. The quality of the blows should be reported in the documentation of the test (e.g., the test was performed well but wheezing was apparent on the forced manoeuvres) as well as checked on the trace where quality is often reported. Timing of the blows is also important with a minimum of one minute between efforts to allow suitable recovery. All efforts should also be shown as in Figure 4: it is not good practice to only show the best blow.
STEP 4. REVERSIBILITY/REPRODUCIBILITY
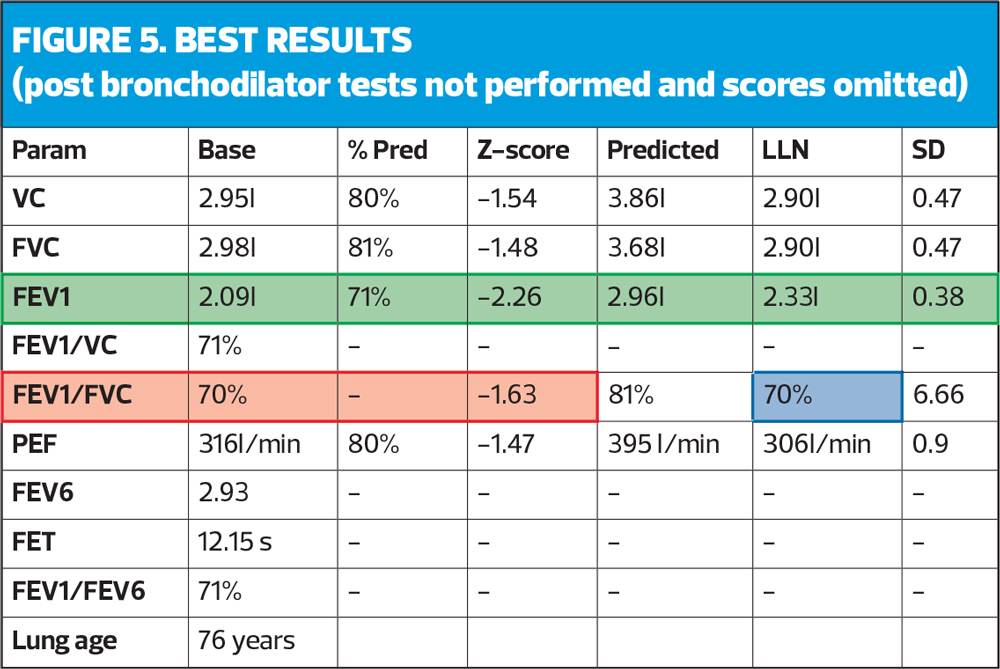
In this part of the review, a check is performed as to whether there have been two tests undertaken (base and post-bronchodilator) known as reversibility or whether there is only one test (as in the example, Figure 5). If there is only one test, it should be assumed this is a pre-bronchodilator test and therefore cannot be used diagnostically. All guidelines state that diagnosis should be made on post-bronchodilator readings.8,9 This does not mean that two tests need to be undertaken in the same session. For example, a patient presenting with clear COPD history and symptoms could have baseline spirometry undertaken which would likely show obstruction (coded as suspected COPD) and they could then be treated with bronchodilator therapy and return 4-6 weeks later. At this appointment a post-bronchodilator assessment (after continuing their treatment) should still demonstrate obstruction and this post-bronchodilator result could be coded as COPD. This pragmatic approach allows two opportunities for patient education and engagement and lessens the risk of infection/exposure with two tests in one session.
This step also checks for reproducibility, which was previously determined as 100mls between the best two blows. In the recent ARTP guidelines5 this value has been increased to 150mls between the best two blows.
In the example they would be reported as:
- The best two VCs are 2.95 and 2.92 with 30mls between them.
- The best two FVCs are 2.98 and 2.86 with 120mls between them.
- The best two FEV1s are 2.09 and 2.04 with 50mls between them.
ARTP has now started assessing peak flows for reproducibility, stating that this is a good measure of how the test is performed. However, this is on ALL efforts and there should be less than 40 l/min between all attempts. The easiest way to calculate this is to take the highest effort, 313 l/min, and deduct 40 l/min. (313 minus 40 = 273) Every other blow should therefore be higher than 273 l/min to be acceptable. In this case they are all acceptable. It is important to remember in accuracy of reporting that all other measures are volumes and are reported in mls whilst PEF is a measure of speed and is reported in litres per minute (l/min).
STEP 5. RATIO
Until this point the systematic approach checks have been focussed on acceptability, but now we move towards numerical interpretation/reporting. The ratio demonstrates the presence of obstruction and is a simple calculation where the best FEV1 is divided into the highest volume (VC or FVC). In this example (Figure 5) the FVC is slightly higher (30mls) then the VC therefore the FEV1 is divided into the FVC.
2.09/2.98 = 0.70134
x100 = 70.13 = 70 (red box, Figure 5). This is a percentage, and shows that the FEV1 is 70% of the FVC.
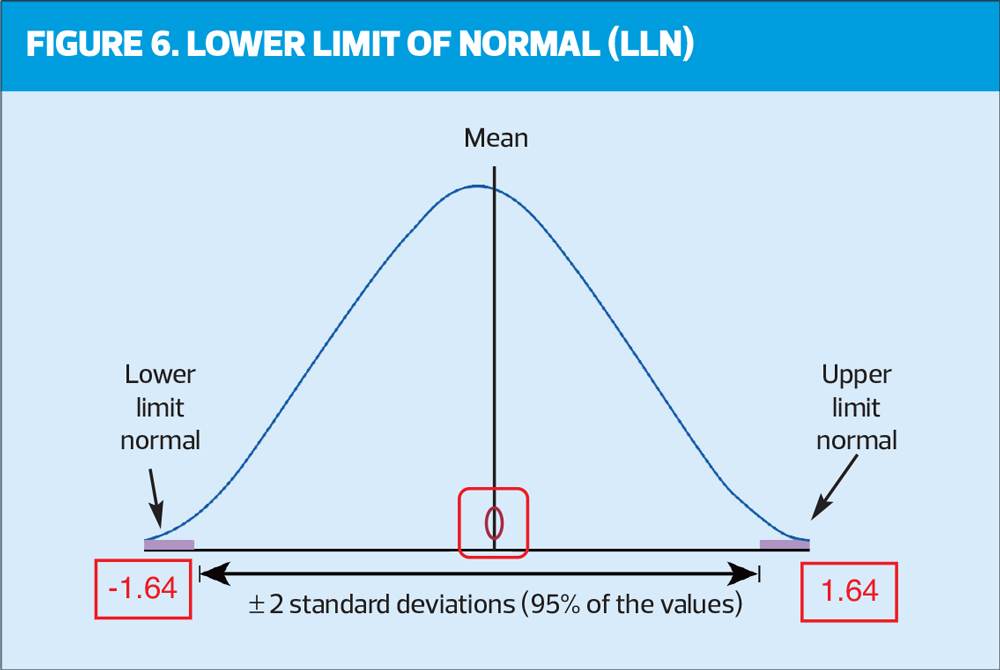
Historically, it has always been stated that a ratio below 70% (0.7) demonstrates the presence of obstruction but more recently there is evidence to suggest that using this fixed ratio is over diagnosing COPD in the elderly and underdiagnosing in the younger population.10 It is important therefore to use the LLN and/or Z scores. Z score is an indication of how far away from normal a test result is. A key point to remember is any result less than -1.64 is below the LLN and relevant. In this example it can be seen the FEV1/FVC ratio is 70% with a Z score of -1.63 (very close to LLN). The blue box shows a LLN ratio of 70%, which agrees with the Z score.
The FEV1 has a Z score of -2.26 and a LLN of 2.33, which again reinforces how ‘far away from normal’ the FEV1 is, in this case abnormal (green box).
Figure 6 may help to visually reinforce LLN.
STEP 6. SEVERITY
Having demonstrated the presence of obstruction (a ratio below 0.7 and below LLN) there is a step in the process to grade the severity of the obstruction. It is important to note this is severity of airflow obstruction and not severity of disease, as at this point there is only a pattern of airflow, and no clinical diagnosis. Mild obstruction does not equate to mild COPD!
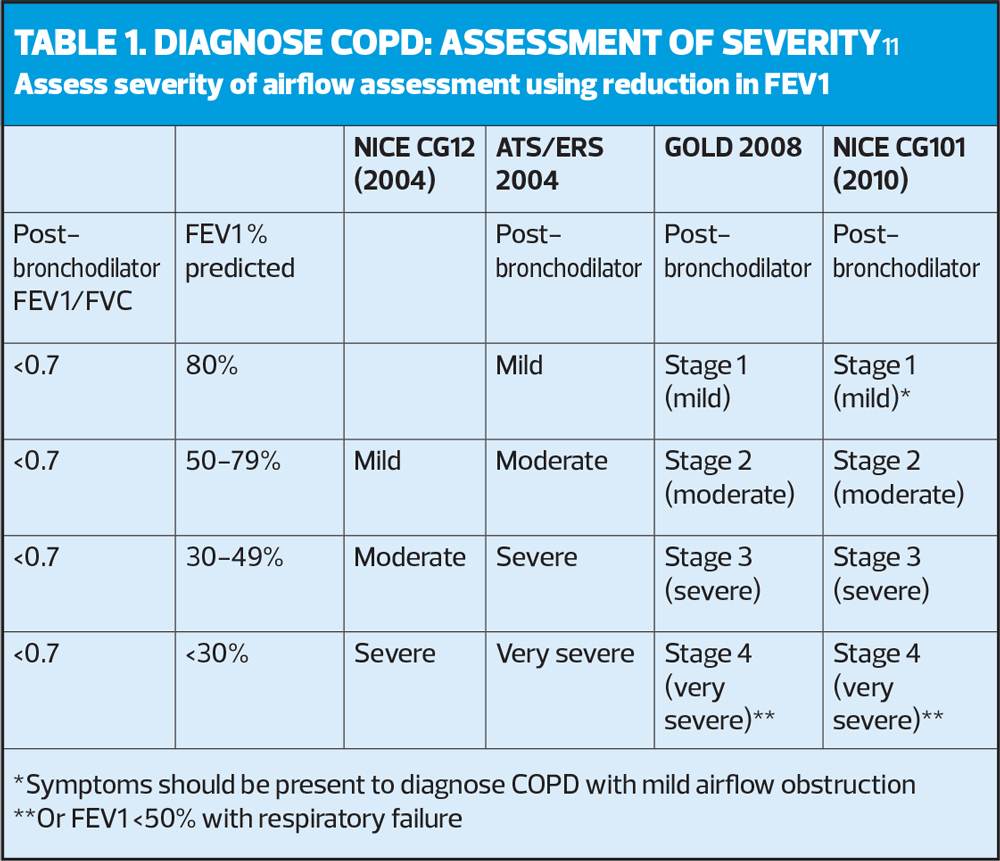
In our example there is potential obstruction (although very borderline) with a ratio of 70% (same as LLN). Therefore, the next step is to grade the severity using the FEV1 % predicted, according to NICE guidelines (Table 1).11
In the example in Figure 1, the FEV1 % predicted is 71%, which would equate with stage 2 (moderate) obstruction (as the FEV1 is between 50-79%). The ARTP advocates that it is better to use Z scores to grade the severity of the airflow,5 (Table 2) as this is a more accurate representation of the probability of finding this score in a healthy population. In the example below the Z score of –2.26 equates to moderate obstruction.
What should be considered is that our patients are not treated according to the FEV1 % predicted or severity of their airflow obstruction. With COPD it is important consider treatable traits, symptoms and risk of exacerbation, and in asthma, airway inflammation is key and should be treated regardless of the severity of airflow obstruction.
STEP 7. CLINICAL PICTURE
In the final step, the importance of clinical history and presentation is fundamental and should be underpinned by appropriate respiratory knowledge and training. There is a pattern of airflow that is identified which can only be ‘diagnosed’ in the context of the clinical history. The demographics highlighted an ex-smoker but without the number of pack years, it is impossible to consider the presence of a smoking-related condition. The results are very close to the LLN so there may be no respiratory condition at all, and this may be ‘normal’ for this person – again dependant on the reason for presentation and testing. There is clear concavity in the FV trace which supports obstruction and an abnormal FEV1 which all need to be clinically reviewed and ‘explained’.
What this demonstrates is that spirometry as a standalone investigation is futile (as is poorly performed spirometry). Any number of health care professionals can be trained to undertake spirometry tests but without the correct history taking or accurate reporting this is a pointless exercise. The advent of artificial intelligence (AI) in spirometry has always been controversial, as AI is seen as very ‘black and white’ whereas spirometry could be seen as ‘shades of grey’. However, ongoing research is promising, with AI demonstrating a potential alternative approach to spirometry interpretation and reporting, helping to provide quality assured testing results and avoiding human error.1 With a diminishing experienced work force this may be a solution.
CONCLUSION
Spirometry will always continue to be a controversial topic whether viewed from a commissioning or clinical angle. What is known is that it is part of a jigsaw of the diagnosis of respiratory disease, and what the pandemic showed was the need for primary care to play an important role in this diagnostic pathway. This article has demonstrated the importance of correct training and updating in an area that is constantly changing.
- For further information on spirometry training in collaboration with Rotherham Respiratory please contact enquires@rotherhamrespiratory.com
REFERENCES
1. Asthma + Lung UK. Diagnosing the problem – right test right time report; 2023 https://www.asthmaandlung.org.uk/diagnosing-problem-right-test-right-time-report
2. NHS England. Quality and Outcomes Framework guidance for 2023/24; 2023 https://www.england.nhs.uk/wp-content/uploads/2023/03/PRN00289-quality-and-outcomes-framework-guidance-for-2023-24.pdf
3. Primary Care Commissioning. A Guide to Performing Quality Assured Diagnostic Spirometry;2013 https://www.brit-thoracic.org.uk/media/70454/spirometry_e-guide_2013.pdf
4. Rotherham Respiratory. Spirometry Interpretation – Seven Steps Course. https://rotherhamrespiratory.com/lungs-courses/spirometry-interpretation-seven-steps-course-online/
5. Sylvester KP, Clayton N, Cliff I, et al. ARTP statement on pulmonary function testing 2020. BMJ Open Resp Res 2020;7:e000575. doi:10.1136/ bmjresp-2020-000575. https://bmjopenrespres.bmj.com/content/bmjresp/7/1/e000575.full.pdf
6. Loveridge C. Seven steps to spirometry: Management in primary care. Independent Nurse 20 April 2020. https://www.independentnurse.co.uk/content/clinical/seven-steps-to-spirometry-management-in-primary-care/
7. Quanjer PH, Stanojevic S, Cole TJ, et al, and the ERS Global Lung Function Initiative. Multi-ethnic reference values for spirometry for the 3–95-yr age range: the global lung function 2012 equations ERS Task Force Report. Eur Resp J 2012;40:1324-1343. https://erj.ersjournals.com/content/40/6/1324
8. NICE NG80. Asthma: diagnosis, monitoring and chronic asthma management; 2017 https://www.nice.org.uk/guidance/ng80/
9. SIGN 158. British guideline on the management of asthma; 2003 (last revised July 2019). https://www.sign.ac.uk/media/1773/sign158-updated.pdf
10. Josephs L, Culliford D, Johnson M, Thomas M. COPD overdiagnosis in primary care: a UK observational study of consistency of airflow obstruction. COPD overdiagnosis in primary care: a UK observational study of consistency of airflow obstruction. npj Primary Care Respir Med 2019;29:33 https://www.nature.com/articles/s41533-019-0145-7
11. NICE CG101. Chronic obstructive pulmonary disease in over 16s: diagnosis and management; 2010. https://www.nice.org.uk/guidance/cg101
12. Quanjer PH, Pretto JJ, Brazzale DJ, et al. Grading the severity of airways obstruction: new wine in new bottles. Eur Respir J 2014;43:505-12. Cited in Sylvester KP, Clayton N, Cliff I, et al. ARTP statement on pulmonary function testing 2020. BMJ Open Resp Res 2020;7:e000575

Related articles
View all Articles