Spirometry: interpretation in the clinical situation
Dr Jon Miles
Dr Jon Miles
MD FRCP MMEd
Consultant Physician. Western General Hospital. Edinburgh UK
Spirometry has become an integral part of assessing patients with breathlessness, but how much help is it really in distinguishing the often-multifactorial nature of this symptom? This article sets out how to position spirometry in the diagnostic assessment of breathlessness and highlights some of the common pitfalls in its interpretation
Breathlessness is now one of the most common reasons why people visit their doctor,1 and there are a number of objective measures undertaken in GP surgeries and hospitals to help identify diseases which may contribute to this symptom. Of these, spirometry, has become an important aid, featuring prominently in recent guidelines for the diagnosis and management of asthma,2 and chronic obstructive pulmonary disease (COPD).3 But:
- When should spirometry be undertaken?
- What is abnormal?
- How sensitive and specific are the findings to specific respiratory conditions, particularly COPD and asthma?
WHY DO SPIROMETRY?
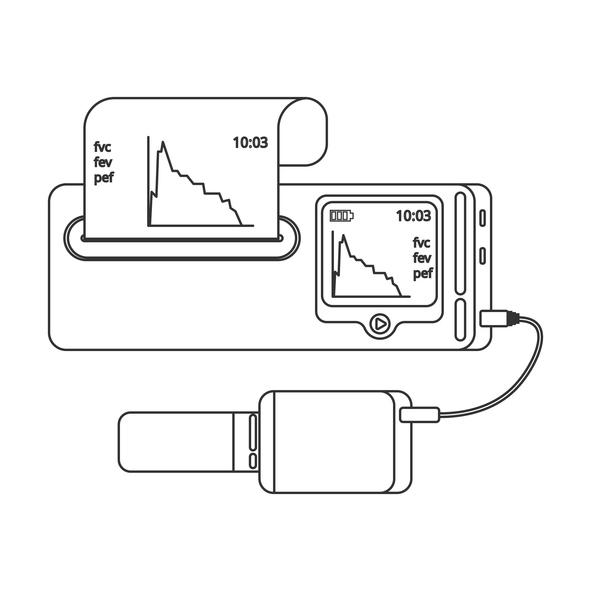
Spirometry has become an important investigation in the diagnosis of patients who present with respiratory symptoms, in particular breathlessness. International guidelines support its use as an integral part of confirming a diagnosis of COPD and asthma.2,3 Modern spirometers are small and portable and therefore suited to use in a community setting, even in people’s homes. However, the procedure is not straightforward and is not always carried out accurately.4,5 Nonetheless, when performed to national standards,6 spirometry can support clinicians trying to identify the causes of breathlessness.
Key to good spirometry begins with accurately measuring height and weight. Then a standardised technique, involving relaxed and forced expiratory manoeuvres over a minimum of three attempts for each manoeuvre, leads to a display of measurements of airway calibre that support the identification of patterns of respiratory defect useful in the diagnosis of respiratory conditions.7
WHAT IS ‘NORMAL’?
People have airways and lung volumes that vary in size according to their age, height and sex. In addition, lung volumes differ between ethnic groups. Within a particular age, height, and ethnic group of the same sex there is also heterogeneity of value. So although the airway flow of air and lung volume in a 76-year-old Caucasian man of 5’9” (175cms) is not exactly the same for every 76 year old 5’9” Caucasian male, getting lots of 5’9” 76-year-old Caucasian men with no known lung disease to do spirometry gives us an idea of what we should expect the flow and volume to be. This has been achieved in a number of populations throughout the world to develop a ‘predicted’ set of values against which we can measure our patients.
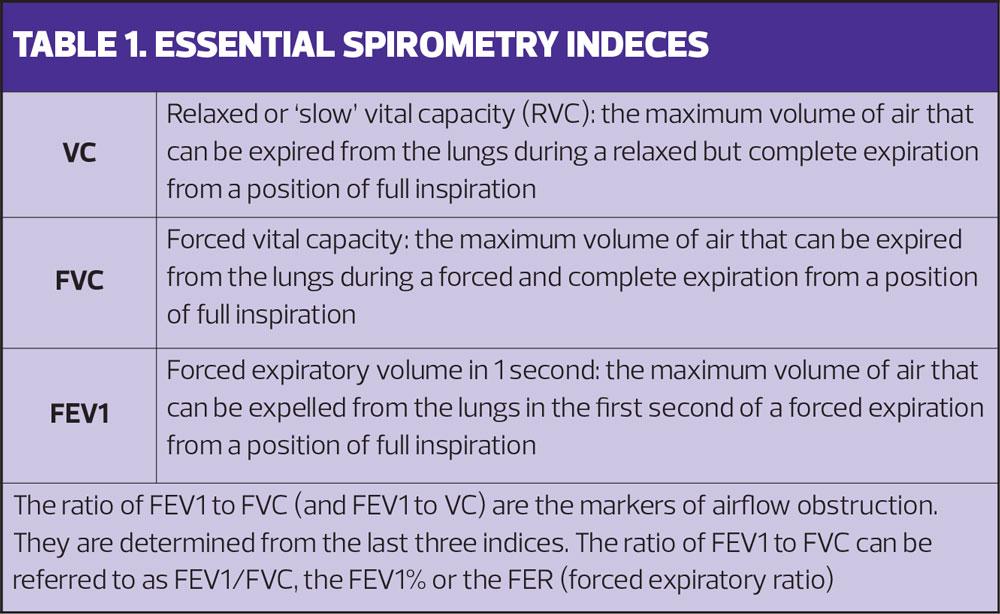
There are four important measurements in spirometry:
- Forced Expiratory Volume in 1 second (FEV1)
- Forced Vital Capacity (FVC)
- Relaxed Vital Capacity (RVC)
- The ratio of FEV1 to whichever is the larger of FVC and RVC (FEV1/(f)VC ratio, Table 1).
One of the commonest pitfalls in performing spirometry is failure to perform a relaxed breath out (RVC) manoeuvre. To be accurate this has to be done before the forced manoeuvres, and if not performed first can affect the ratio, particularly in patients with associated emphysema as well as airways disease. (Remember asthma, COPD and emphysema are all different, even though they can co-exist.)
THE NUMBERS
So assuming all the manoeuvres have been performed properly we can now begin to look at the patterns.
Usually people can breathe out over 70% of their total expiratory volume in the first second of a forced manoeuvre. Therefore, the most important pattern to look for in spirometry is whether the FEV1/(f)VC ratio is more or less than 70% (or 0.7). A ratio of less than 0.7 indicates airway narrowing and should alert you to the possibility of airways diseases, such as COPD and/or asthma.
However the ratio is not the only important parameter in spirometry. Each individual measurement of relaxed (RVC) and forced (FEV1 and FVC) manoeuvres has a value that we should compare to our ‘predicted’ range. There are two usual methods of examining this data; ‘percent predicted’ and ‘lower limit of normal’ (LLN).
Percent Predicted
This compares the values to all people of a particular age, height, sex and ethnic group and assumes every one of those people would blow the same.
Lower limit of normal
LLN assumes that all people of a given age, height, sex and ethnic group will not blow the same and that it is important for the particular value to be outside the lower limit of the normal range before it is classified as ‘abnormal’.8 Why is this important? While the classification of COPD does involve a numerical component (FEV1/(f)VC of <0.7), some studies have suggested that certain age groups – the elderly in particular – may be falsely labelled as having COPD if calculations are based on percent predicted as opposed to LLN.
From a practical point of view, you should always be aware that patients with values only just mildly in the abnormal range may not represent actual disease but merely a statistical anomaly. Many machines now undertake an automatic interpretation of the values so you need to be aware of the methods the machine uses as, again, misclassifications have been reported.9
GRAPHIC DISPLAYS
If you are the sort of person who finds numbers and ratios all a bit confusing then you may be more suited to looking at the non-numeric displays many spirometers produce. Small spirometers that produce only numeric displays are not suitable for diagnostic spirometry.6 Two types of graphic display are popular:
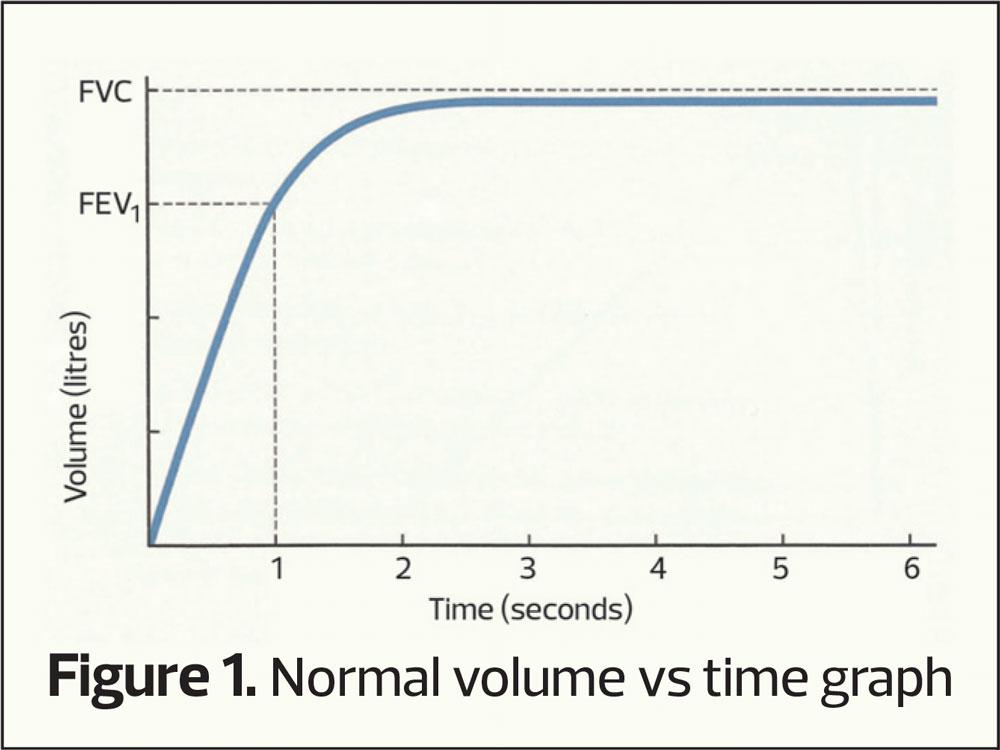
- Volume vs Time Graph (Figure 1)
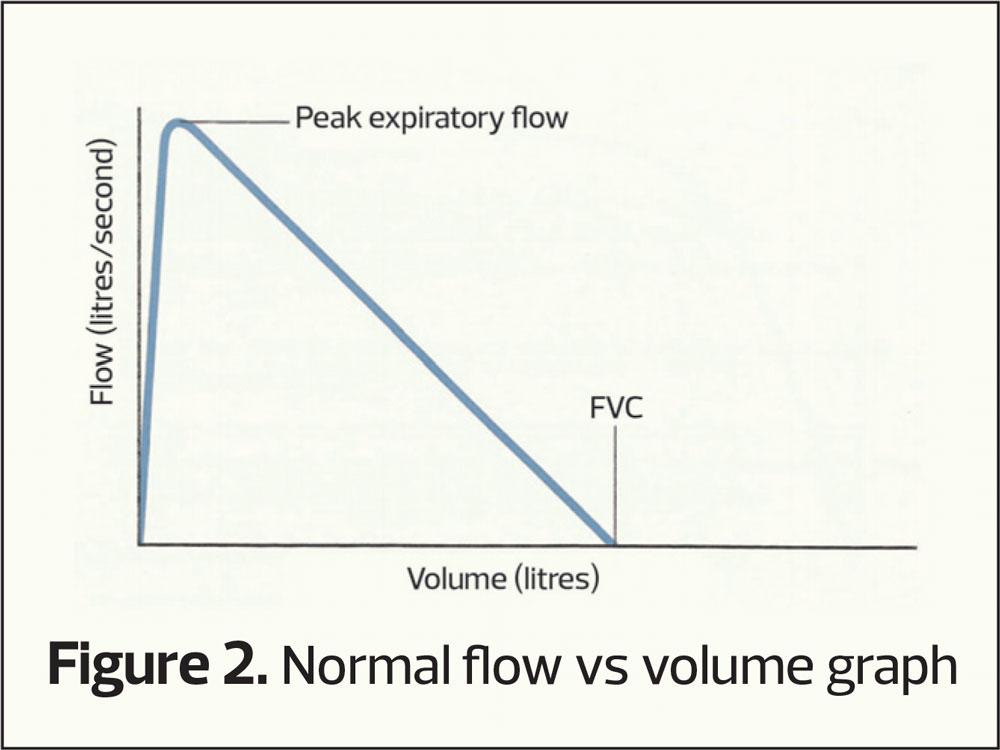
- Flow vs Volume Graph (Figure 2)
The volume-time curve
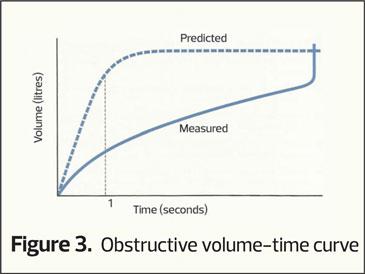
This plots how much air is exhaled (vertical axis) per second (horizontal access). As seen in figure 1 the majority of air is exhaled in the first second and the curve flattens out as vital capacity is approached. If there is airway narrowing then less air is exhaled in the first second, altering the shape of the curve (an obstructive picture), the pattern most commonly associated with COPD (Figure 3). Normally it takes around 4 to 6 seconds to exhale completely (FVC) and when there is airway narrowing it can take longer to exhale to FVC.
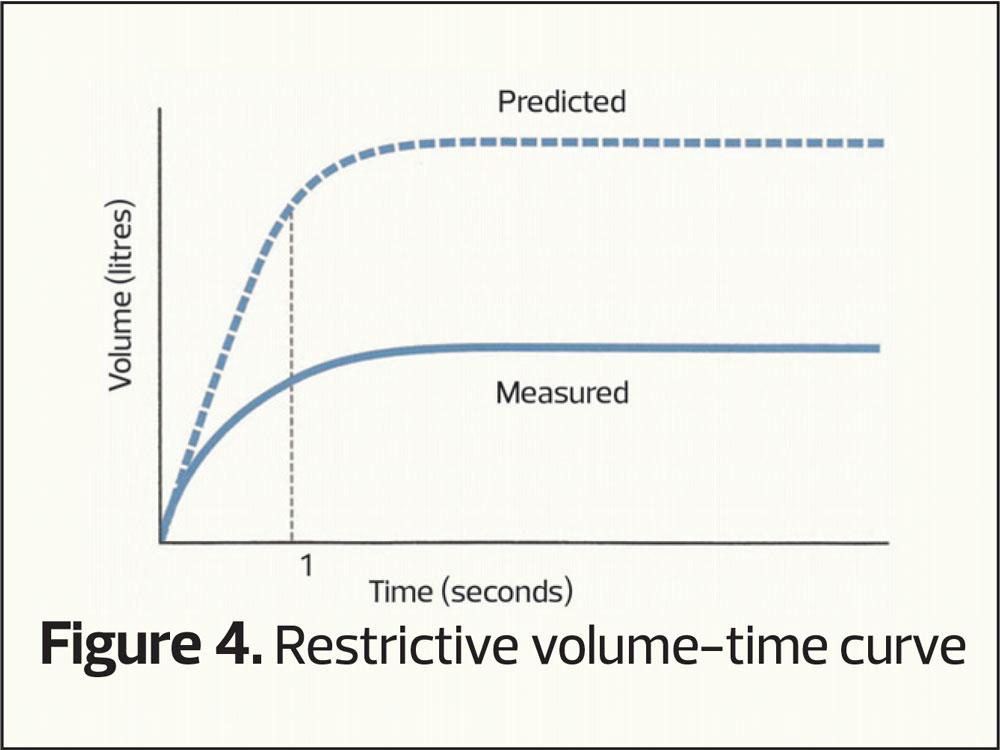
However, another common pattern can occur when both the FEV1 and the (f)VC are reduced giving a smaller curve (restrictive pattern, Figure 4). This pattern is seen in people who are overweight or have musculoskeletal disorders, but is also seen in those who may have conditions that cause small lung volumes, such as pulmonary fibrosis.
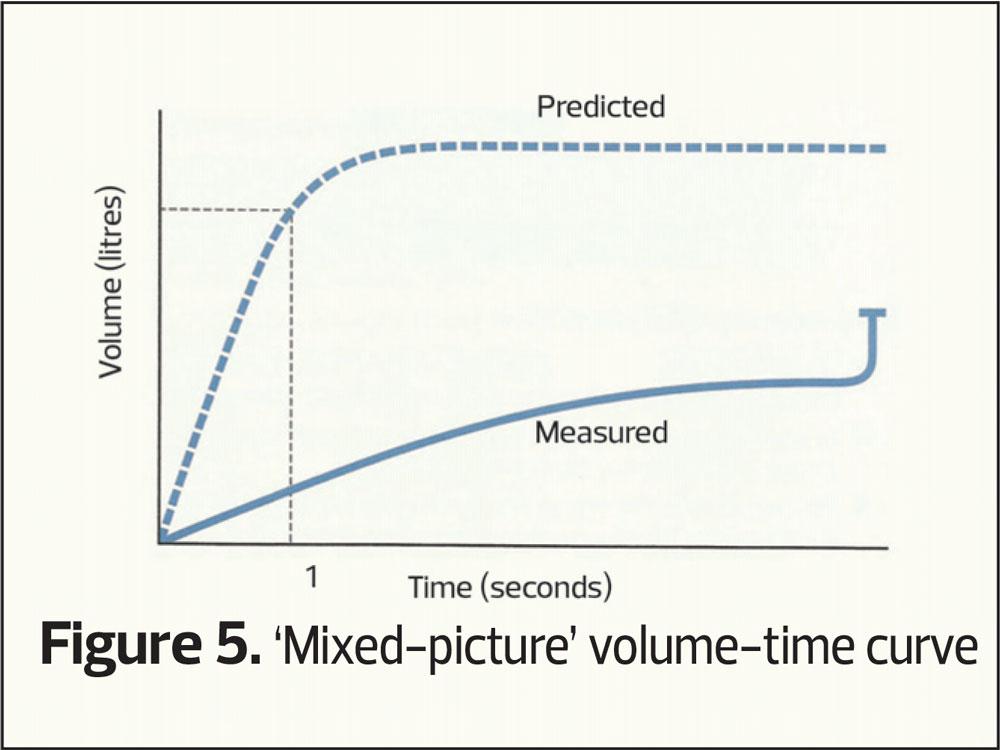
Finally, as with all things, mixed patterns can occur, where there is both evidence of airway narrowing and small volumes (a mixed picture, Figure 5).
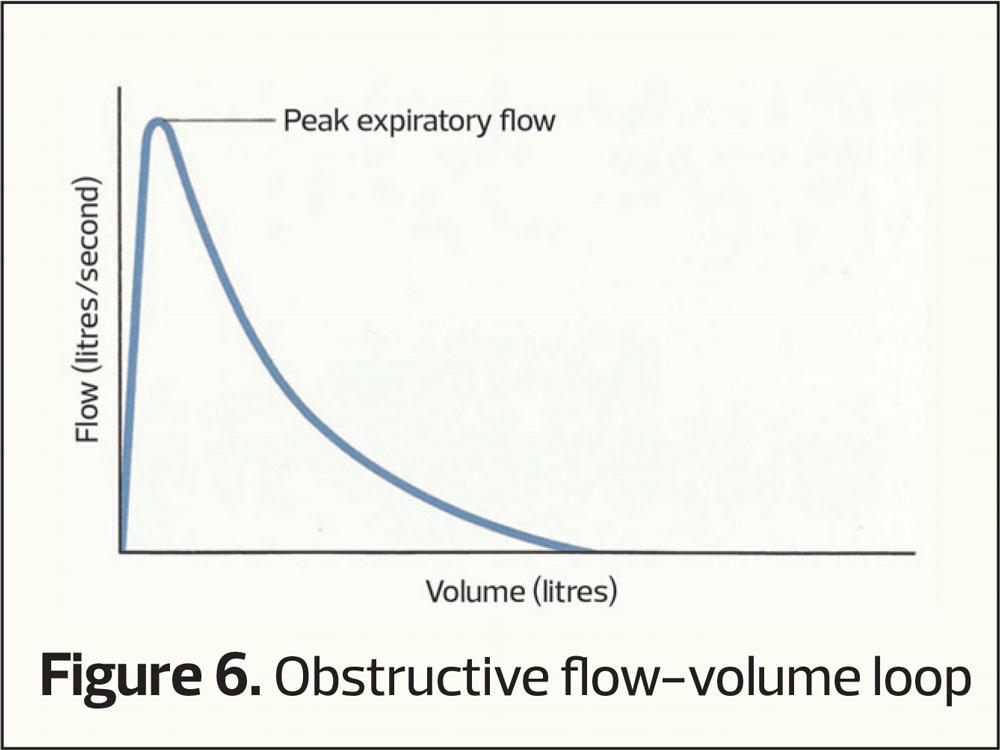
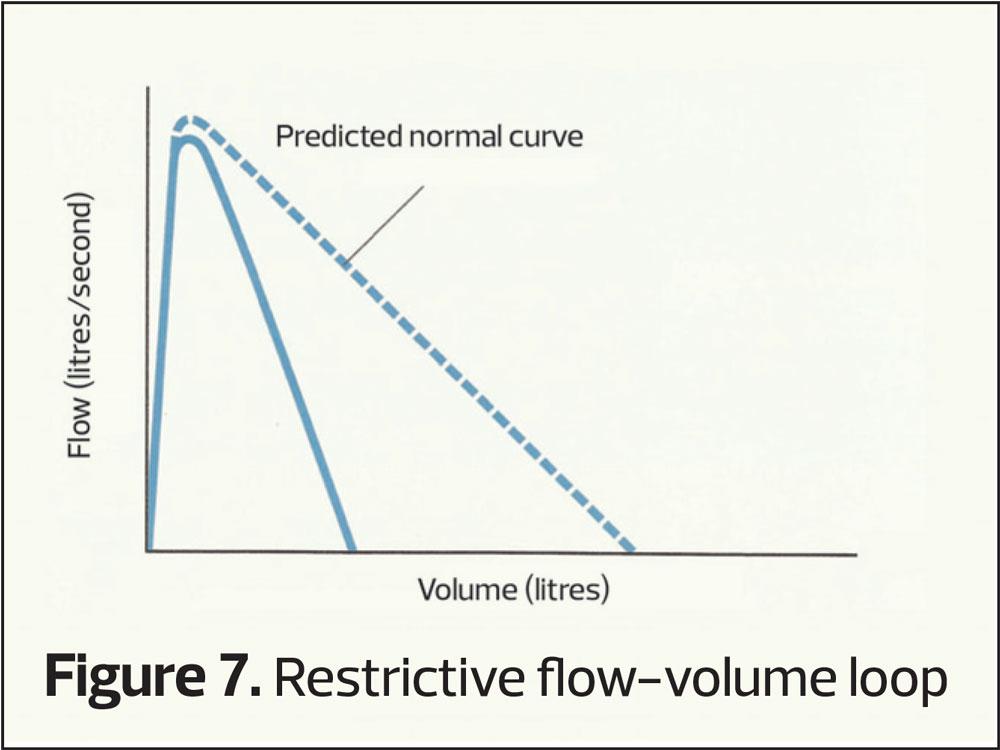
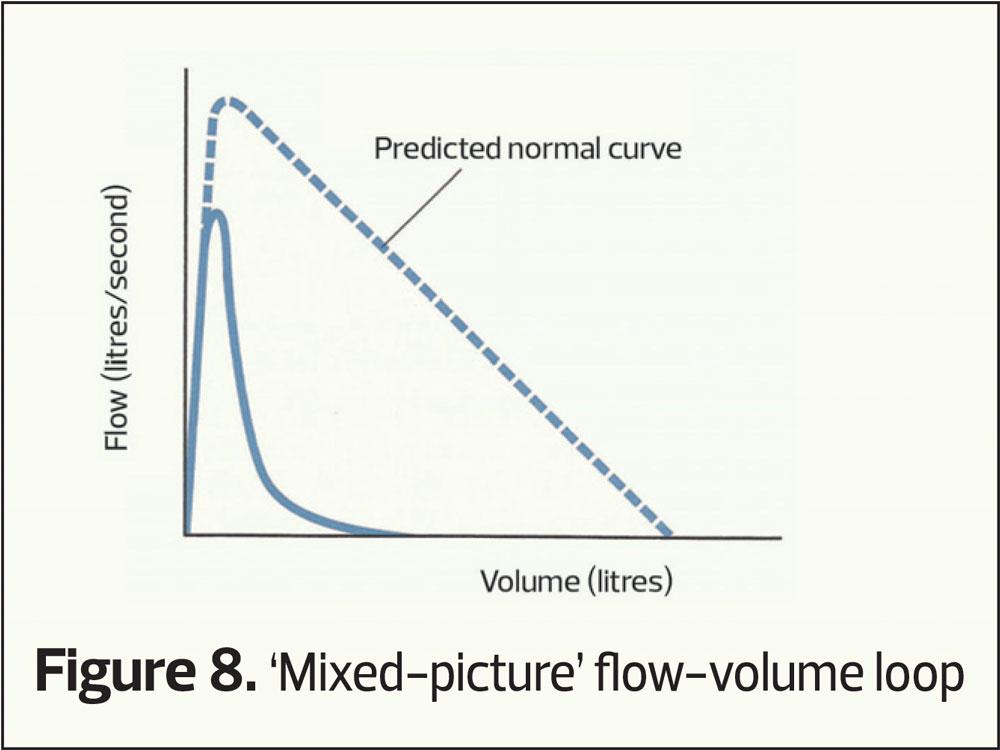
The flow-volume loop
This plots the speed of air through the airways (vertical axis) at differing lung volumes (horizontal axis). It provides the same sort of information as volume-time curves only with differing characteristic shapes (Figures 6–8). Again RVC, FEV1 and FVC can be calculated from a flow-volume loop.
APPLICATION TO CLINICAL PRACTICE
So where does this leave spirometry as an aid to clinical diagnosis? Well sometimes it can confirm a very characteristic clinical suspicion. For example, a person who has smoked all their life, with a gradual onset of breathlessness on exertion and a morning cough of white phlegm, may have an obstructive pattern of spirometry and a ratio of FEV1/(f)VC of less than 0.7. This person has symptoms, exposure and abnormal spirometry making COPD a clear-cut diagnosis.
However, spirometry can sometimes be much less discriminatory. For example the same man may have normal spirometry on testing because his predominant lung disease is emphysema, a disease of the alveoli as opposed to the airways. In such instances there is sometimes a clue with the RVC being bigger than the FVC measurement but usually more hospital-based lung function testing is required to confirm the clinical picture. Similarly, a patient with a good history for asthma (a variable and reversible inflammatory condition) may have completely normal spirometry at the time of testing.
Reversibility testing
Both asthma and COPD guidelines discuss ‘reversibility testing’ or ‘post-bronchodilator’ measurement. So should everyone who has spirometry also have a test to see whether they respond to bronchodilators; and if so which ones (beta-agonists or anticholinergics)?
Over the years there has been a great deal of debate about the value of reversibility testing.10 It used to be claimed that asthma could be diagnosed with a 12% or 200ml improvement in FEV1 following the administration of an inhaled beta-agonist.11 However, it is now recognised that this is a simplistic explanation. Over 50% of patients with a suspected diagnosis of asthma will not demonstrate this sort of response to beta-agonist (remember the definition of asthma talks about ‘spontaneous’ reversibility too) and patients with COPD can also respond significantly to both beta agonists and anticholinergics.12
NOW I’M MORE CONFUSED THAN WHEN I STARTED!
One of the differences between common respiratory diseases such as asthma and COPD as opposed to hypertension, diabetes or chronic kidney disease is that there are no unequivocal numeric definitions of disease. To have hypertension, your blood pressure is measured at a particular level; for diabetes your blood sugar should be elevated; for kidney disease your glomerular filtration rate (eGFR) should be reduced. Asthma and COPD have no such clear-cut numeric definitions and this is what makes clinical practice interesting as well as frustrating.
Recent guidelines for both asthma,2 and COPD,3 are focusing now on ‘pattern recognition’ as opposed to a numbers only approach. Does the history suggest asthma (disease since childhood, variability in symptoms, wheeze, response to previous inhalers, associated hay fever, eczema etc.) or COPD (smoker, air pollution, lack of variability of symptoms etc.)? In these instances spirometry helps confirm your thought processes (e.g. airway narrowing in COPD, reversibility in asthma) but spirometry will never be a means to an end, more a pointer in the direction of the difficult journey in confirming respiratory diagnoses.
IN SUMMARY
Respiratory symptoms are common, but patterns of respiratory symptoms can also alert clinicians to lung diseases such as asthma or COPD. Spirometry is an easily available test of airway function and if performed correctly can aid clinicians in establishing evidence towards a particular respiratory diagnosis. It is vital that spirometry is used in the context of many other clinical parameters, of which the clinical history is by far the most important, but clinicians should always remember that non-respiratory conditions can also affect the values; e.g. an overweight patient who is breathless, or the little old lady with osteoporosis and a scoliosis.
The focus should always be on performing a competent test. Poorly performed, or inaccurately interpreted spirometry is worse than useless. It can result in misdiagnosis or missed diagnosis, and lead patients to being given ineffective and/or inappropriate or harmful treatment. The clinicians who perform and interpret spirometry will need to be properly trained and certified as competent.4
The results of a competently performed and interpreted test can then be applied to the bigger clinical picture. Used in this way spirometry is a useful tool in the management of respiratory conditions and in the exclusion of suspected respiratory diagnoses.
REFERENCES
1. Dempsey TM, Scanlon PD. Pulmonary Function Tests for the Generalist: A brief review. Mayo Clin Proc 2018;93(6):763-77
2. SIGN 158. British guideline on the management of asthma; 2019. https://www.sign.ac.uk/assets/sign158.pdf
3. GOLD. Global strategy for the diagnosis, management and prevention of chronic obstructive pulmonary disease: 2019 Report. https://goldcopd.org/wp-content/uploads/2018/11/GOLD-2019-v1.7-FINAL-14Nov2018-WMS.pdf
4. Improving the quality of diagnostic spirometry in adults: The National Register of certified professionals and operators; 2016 http://www.artp.org.uk/en/spirometry/artp-spirometry-register.cfm
5. Hegewald MJ, Gallo HM, Wilson, EL. Accuracy and quality of spirometry in Primary Care Offices. Ann Am Thoracic Soc 2016;13(12):2119-2124
6. A guide to performing quality assured diagnostic spirometry 2013; https://www.pcc-cic.org.uk/sites/.../spirometry_e-guide_1-5-13_0.pdf
7. Miller MR. How to interpret spirometry. Breathe 2008;4(3):259-261
8. Guder, G, Brenner S, Angermann CE, et al. GOLD or lower limit of normal definition? A comparison with expert-based diagnosis of chronic obstructive pulmonary disease in a prospective cohort-study. Respiratory Research 2012;13:13-21
9. He X-O, D’Urzo A, Jugovic P, et al. Differences in spirometry interpretation algorithms: influence on decision-making among primary care physicians. NPJ Prim Care Respir Med 2015;25:15008
10. Ye Q, Liao A, D’Urzo. FEV1 reversibility for asthma diagnosis: a critical evaluation. Exp Rev Respir Med 2018;12:265-267
11. Chabra SK. Clinical application of spirometry in asthma. Lung India 2015; 32(6):635-637
12. Calverley PMA, Burge PS, Spencer S, et al. Bronchodilator reversibility testing in chronic obstructive pulmonary disease. Thorax 2003;58:659-664
Related articles
View all Articles